
A hypothetical index has fallen 8.86% from a closing high of 5,009.92 to a close of 4,566.04. Eight sessions after that low, it gains 1.10% to close at 4,751.13, and composite volume rises from 3.88 billion to 4.36 billion shares. Under the usual working rule, that’s an accumulation day. The harder question is how much weight it deserves when you’re deciding whether the market backdrop supports growth-stock bases and breakouts.
This guide follows that one session through the days around it, revealing the chart in the order a trader would have seen it. Every number comes from a single made-up 60-session index series, labelled D1 to D60, so the arithmetic can be checked end to end.
A working definition of an accumulation day
The simplest version needs two comparisons. The index closes above the previous session’s close, and volume comes in above the previous session’s volume. Some versions add a minimum percentage gain, others want the close in the upper part of the day’s range, and some compare volume with a moving average instead of the prior day. No single standard exists, so the label depends on the rule you pick.
The rule choice changes the count more than most readers expect. Across the recovery from D45 to D60, the simple two-condition rule flags five sessions: D48, D52, D55, D58 and D60. Add a requirement that the gain be at least 0.5% and the list shrinks to three: D48, D52 and D60. D55 and D58 qualified only on gains of 0.2% and 0.3%. The same simple rule also flags three sessions during the decline itself (D28, D32 and D36), which is a useful reminder that an accumulation day can show up inside a market that keeps falling.
The name invites a misread. Aggregate volume counts matched trades, and every share bought was sold by someone. Volume can’t reveal who the buyers were, whether they were funds building positions, short sellers covering, or index products rebalancing. “Accumulation” is an interpretation of price and participation together. What the evidence supports is narrower: more shares changed hands on a day when buyers were willing to pay higher prices into the close.
Reading the sequence one session at a time
The chart below shows all 60 sessions with a 21-day EMA and a 50-day SMA, both computed from the closes. The 50-day line only appears once 50 sessions exist, which is why it starts at D50. Read it left to right and stop at each date in the table before looking further.
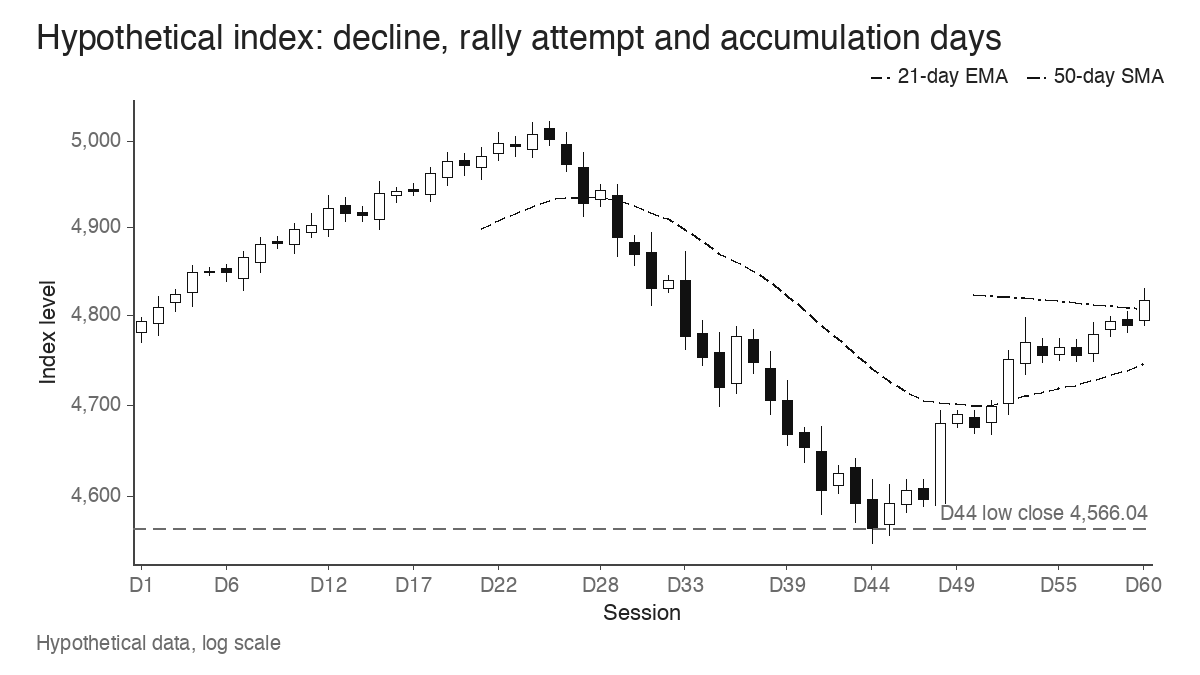
| Session | What the chart shows | What it adds to the evidence |
|---|---|---|
| D44 | Close at 4,566.04, down 0.60%, volume up 12.2% to 4.40 billion | The low close of the decline, on rising volume. Nothing yet says the selling is done. |
| D45 | Up 0.60% to 4,593.44 on lighter volume, 3.98 billion | Day 1 of a rally attempt. A first up close after a low proves very little. |
| D48 | Up 1.80% to 4,680.77, volume 4.71 billion against 3.80 billion (up 23.9%), close at 88% of the day’s range | Day 4 of the attempt with a large gain on higher volume. This is the session a follow-through framework would examine. |
| D52 | Up 1.10% to 4,751.13, volume 4.36 billion against 3.88 billion (up 12.4%), close at 86% of the range | An accumulation day under any of the rules above, with price 0.99% above a rising 21-day EMA. |
| D53 | Up 0.40% to 4,770.14 on lighter volume, 4.02 billion | Progress continues, but participation eases. Under the definition this session doesn’t count. |
| D54 to D60 | Lowest close 4,755.81 on D56; D60 closes at 4,817.87 | The D52 gain is held, and by D60 the index closes above the 50-day SMA at 4,807.84. |
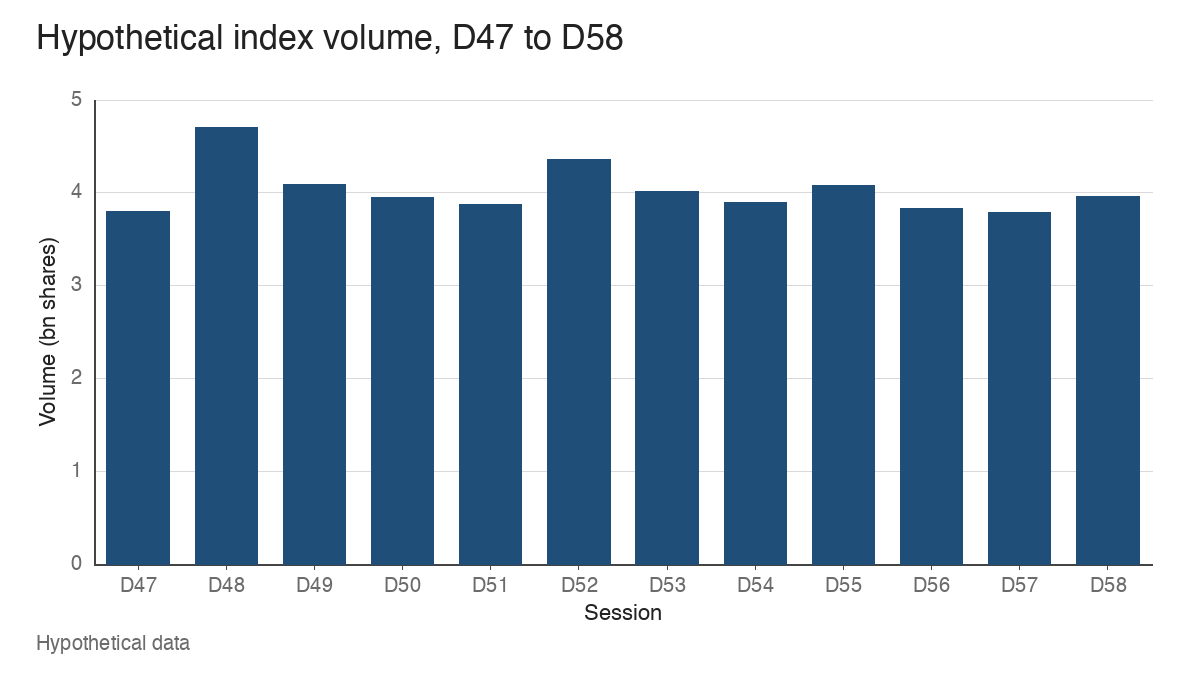
The volume pane tells the same story at a glance. D48 and D52 stand out above their neighbours, while D53 sits back below D52.
Two up days, two different weights
D52 and D53 both closed higher, so a quick glance might file them together. They carry different information. D52 combined three things: a gain of 1.10%, volume 12.4% above the prior session, and a close at 86% of the way from the low of 4,690.19 to the high of 4,761.05. The index finished near its high for the day.
D53 added another 0.40%, but volume fell 7.8% to 4.02 billion and the close landed at 55% of the range, well off the 4,798.66 high. That’s a quieter session. It falls outside the definition, and on its own a lighter-volume advance like this one simply holds ground without adding new evidence of demand.
Closing location deserves as much attention as the percentage change. A 1.10% gain that closes near the low of a wide range tells you sellers met the advance during the session. A gain that closes near the high, as D52 did, says they didn’t.
Preserved or erased: what the next sessions decide
An accumulation day is provisional until later sessions either keep or give back the progress. In the example, the lowest close from D54 through D60 was 4,755.81, slightly above the D52 close of 4,751.13. The gain survived a full week of trading.
Now run the alternative. Suppose D54, D55 and D56 had instead fallen 0.8%, 0.7% and 0.6% from the D53 close of 4,770.14. The index would have closed D56 at 4,670.66, which is 0.61% below the D51 close of 4,699.44. On that path, everything D52 and D53 achieved is gone, and the volume that came with D52 no longer counts for much. The chart would read as a failed push into resistance.
The decline offers a real case of the same thing. D36 rose 1.20% to 4,777.15 on volume 14.1% above the prior session, closing at 85% of its range. By D38 the index closed at 4,705.75, below the D35 close of 4,720.50. Two sessions erased it.
Same footprint, different backdrop
On the daily candle alone, D36 and D52 look almost identical: both gained more than 1%, both closed in the top fifth of the range, both came on higher volume. Context separates them.
D36 closed 1.74% below a 21-day EMA that was still falling (it dropped 8.47 points that day). An accumulation day beneath a declining average can be a reflex bounce inside the decline, and here it was undone two sessions later. D52 closed above a 21-day EMA that had just turned up, 4.68 points higher on the day, after a rally attempt had already produced a strong D48 session. It was still 1.46% below a declining 50-day SMA, so the recovery had further to go, though the evidence was stacking in the same direction.
That’s the practical test. A cluster of constructive sessions while an index reclaims support carries more weight than the same cluster under averages that keep sloping down. The second case can turn into the first, which is why the count on its own can’t settle the question.
Leading growth stocks are the other half of the check. If the index is posting accumulation days while former leaders keep breaking down from their bases, the index evidence is thinner than it looks. A better backdrop shows the reverse, with names in sound bases starting to clear pivots on volume, which is the pattern described in how leading stocks reflect market context.
Where a follow-through day fits
The follow-through day is a specific rally-confirmation event from the market-timing approach associated with William O’Neil. In the usual description, it arrives from about the fourth day of a rally attempt as a sizeable index gain on volume above the previous session. D48 fits that description: day 4 of the attempt that began at D45, a 1.80% gain, and volume up 23.9%.
Every follow-through day passes the simple accumulation test, but the reverse doesn’t hold. D52 is an accumulation day that arrives after confirmation and adds to it. D36 passed the same test with no rally attempt in place at all, so treating it as confirmation would have been a mistake. Accumulation days are supporting evidence inside a framework; they don’t start one.
They also sit opposite distribution days, the down sessions on higher volume. D44 itself was one, a 0.60% loss on 12.2% more volume at the low of the decline. Reading the two counts side by side gives a fairer picture than either alone. A market that keeps logging accumulation days while distribution days pile up is sending mixed evidence.
Volume traps that inflate the count
The definition rests on a day-to-day volume comparison, so anything that distorts one session distorts the label.
- Source consistency. Exchange-only volume and consolidated volume differ, and data vendors revise late prints. Compare like with like, from one source, every day.
- Holiday sessions. Suppose a half-day session trades 2.10 billion shares and the next full session trades 3.80 billion. The comparison shows an 81.0% jump, yet 3.80 billion is lighter than 10 of the 12 sessions in Figure 2. The increase reflects the shortened day before it.
- Expiration and rebalancing. Options expiration, index futures expiry and index reconstitution days often bring heavy turnover that has nothing to do with fresh demand. An up close on one of those dates can qualify mechanically and still mean little.
- Narrow leadership. A cap-weighted index can rise on a handful of very large stocks while most issues fall. Checking the advance-decline line shows whether the gain was broad or concentrated.
What an accumulation count can’t promise
An apparent accumulation day can be reversed, as D36 was within two sessions, and a tally of five or three such days can’t guarantee that the uptrend lasts. Even a healthy backdrop only improves the odds for an individual stock; a breakout can still fail on its own merits. The useful read in this example is the combination at D52: a follow-through already in place, a close near the high, price holding above a rising 21-day EMA, and the gain preserved through D60. Treat accumulation days as one input to that judgement, and weigh them by where they occur.
Learn the pattern. Ride the trend. Keep the gains.
Educational content only. Not investment advice. Trading involves risk. You are responsible for your decisions.
Get the free Market Wisdom e-book
Join Trends and Breakouts — historical winners, breakout studies, and risk lessons. No spam, unsubscribe anytime.