For five months after its 22 July 2020 spike to 696, Bionano Genomics drifted lower on volume that sometimes dropped to a few thousand shares a day. Then on 23 December the stock jumped 40.4 percent in a session. When BNGO shows up on traders’ screens again, this is the chart worth studying. The bngo base breakout in one line: a December 2020 close through a 356.94 pivot on 12.6 times average volume, followed by a +1218.7% price change in 62 calendar days.
Key takeaways from the BNGO run of December 2020
- The pattern: a five-month base under the 696 July high, with lows at 284.10 in September and 284.34 in November.
- The entry: a 465 close on 23 December 2020, 30.3 percent above the 356.94 pivot, on volume 12.6 times the 20-day average.
- The move: a 9414 peak on 16 February 2021 and an exit at 6132 on 23 February, +1218.7% in 62 calendar days.
- The add: 14 January 2021 at 4170, after the 46.0 percent pullback from the 4 January high had recovered.
- The lesson: in a move this fast, the 20-day moving average held the trend from late December to 22 February, and its first closing break came the day before the exit.
The BNGO trade at a glance
| Field | Value |
|---|---|
| Ticker | BNGO |
| Breakout date | 23 December 2020 |
| Breakout close | $465.00 |
| Volume vs 20-day average | 12.6x |
| Exit date | 23 February 2021 |
| Exit close | $6132.00 |
| Price change, entry close to exit close | +1218.7% |
| Calendar days | 62 |
| Peak before exit | $9414.00 (16 February 2021) |
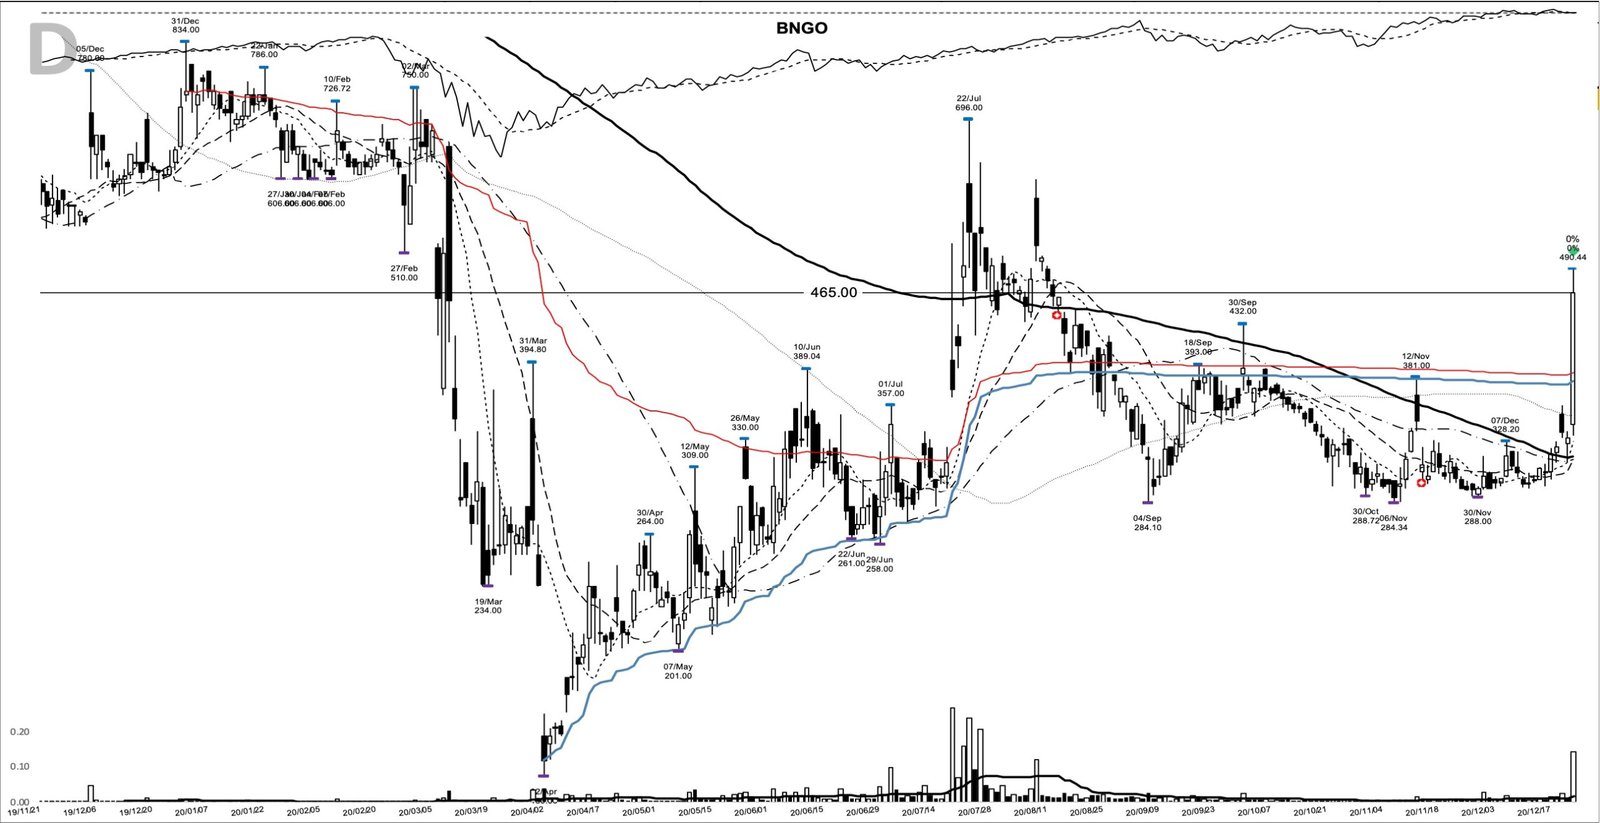
How the BNGO base breakout formed under 356.94
The base starts at the 22 July 2020 high of 696, a one-day spike on 237,153 shares that closed at 534.90. From there the chart rolled over. It found a 284.10 low on 4 September, bounced to 432 on 30 September, and then slid back through October.
The right side of the base is the quiet part. BNGO set a 284.34 low on 6 November and a 288 low on 30 November, and from 24 November to 16 December every close sat between 293.34 and 317.28. On 5 November only 3,089 shares changed hands. By the entry, the 20-day and 50-day moving averages were flat and nearly level, at 314.62 and 315.09.
The first stir came on 21 December, a push to 356.94 on 25,037 shares that closed back at 335.58. That high became the 20-day pivot.
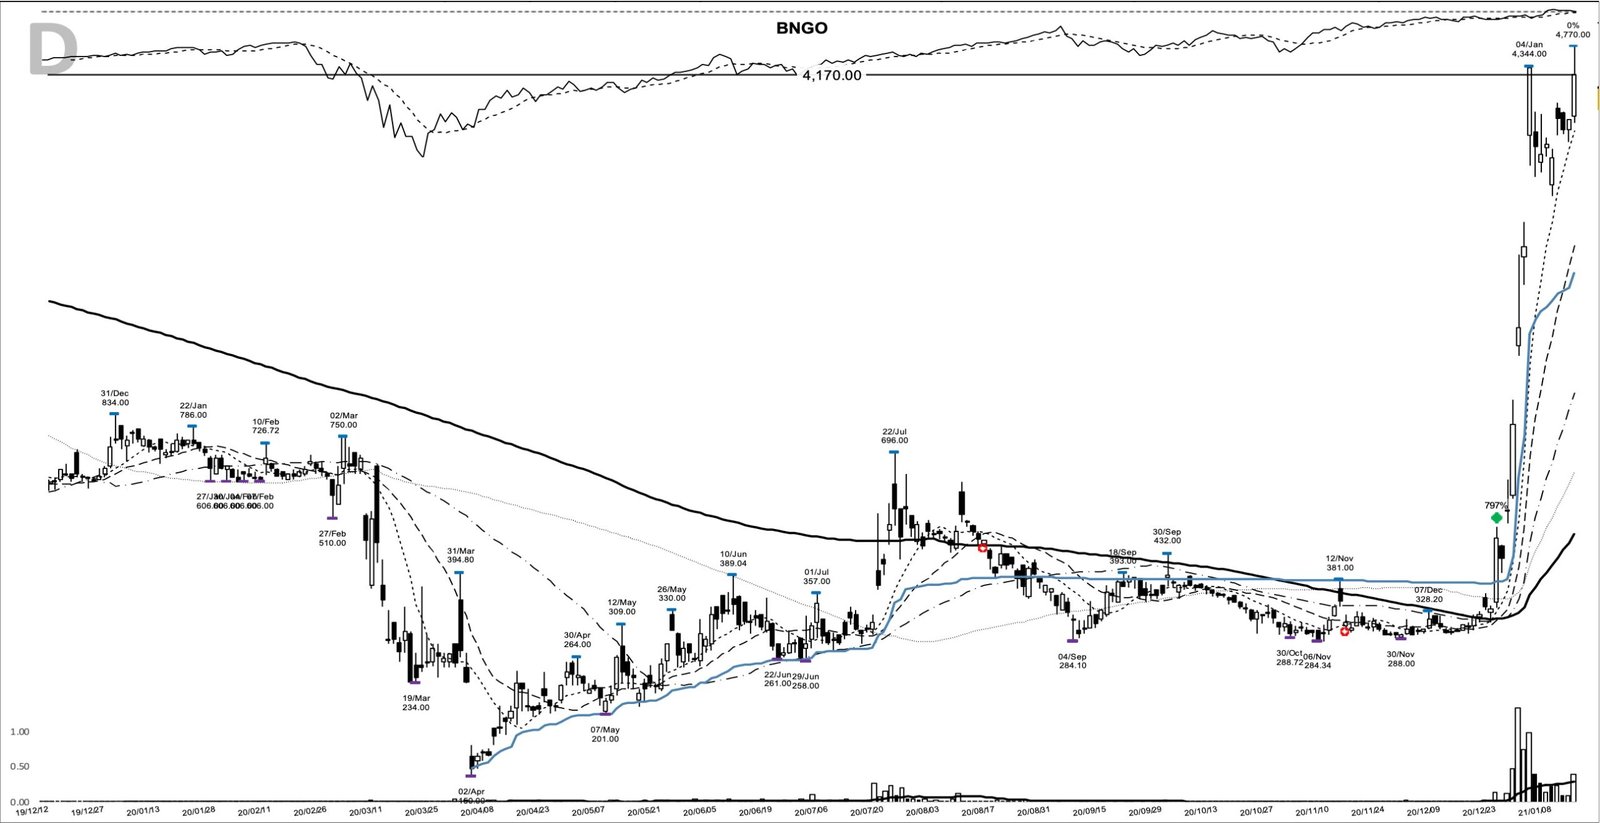
Two sessions later the stock opened at 342, still under the pivot, traded through it and reached 490.44 before closing at 465. That close cleared the pivot by 30.3 percent, so this was a confirmed breakout on a closing basis, on 142,974 shares against a 20-day average of 11,350. Even so, the stock remained 44.2 percent under its 834 high of 31 December 2019.
Bionano Genomics in late 2020: a mapping tool, a lab, and losses
Bionano sold Saphyr, an optical genome mapping system for finding large structural changes in DNA. In August 2020 it bought Lineagen, a diagnostics lab, to add a services business that could run tests built on that platform, per its third-quarter 10-Q.
The numbers in the SEC filings show a company still shrinking on a year-over-year basis. Revenue was 1,182,000 dollars in the June 2020 quarter, down 45.7 percent from a year earlier, and 2,196,000 dollars in the September quarter, down 33.7 percent. Earnings per share were -0.09 and -0.08 in those two quarters. In William O’Neil terms there was no earnings growth here at all.
The story arrived in a burst of company releases. On 28 December Bionano announced that customer Praxis Genomics had become a CAP-accredited lab running a Saphyr-based test. On 30 December it said Nasdaq had granted a further 180 days to regain the 1 dollar minimum bid price, a reminder of how low the unadjusted share price was. On 4 January 2021 its Lineagen unit published autism-gene findings from Temple Grandin’s genome.
The company used the demand. An offering priced at the end of the first week of January closed on 12 January with about 101.8 million dollars of gross proceeds, and a second, 230 million dollar offering closed on 25 January. On 14 January, the third day of the company’s cytogenomics symposium on Saphyr in cancer research, the stock closed at 4170, 23.4 percent higher on the day and 796.8 percent above the first buy.
The tape behind the move: record highs and a speculative winter
The S&P 500 finished 2020 at a record close, and the Nasdaq Composite posted its best year since 2009. Small, story-driven names ran hardest. An eToro year-end report put BNGO’s December gain at more than 500 percent.
That kind of tape ended abruptly. Bloomberg reported that ARK Innovation, the fund most tied to speculative growth, peaked on 12 February 2021 and lost a fifth of its value by early March as the 10-year Treasury yield climbed from 1 percent toward 1.35 percent. The BNGO peak came on 16 February.
Spotting the 356.94 pivot before 23 December
By the entry morning, BNGO had closed above its 10-day moving average for seven straight sessions, and the short averages had turned up from a flat floor. The watchlist case was a long base that had stopped making lower lows, a dry right side, and a first volume burst on 21 December.
A trend follower’s plan that day might have read: a buy-stop above the 356.94 pivot, with an initial stop under the 295.5 shelf low of 16 December. That’s 61.44 a share, 17.2 percent of the pivot. The 258 low of 29 June 2020 marked where the whole structure would fail. After that, trail the 10-day line and widen to the 20-day once the trend was well advanced.
The fill price mattered more than usual. The stock opened under the pivot and ran through it, so a stop order would have filled near 356.94. Someone who waited for the close bought at 465, 41.6 percent above the 10-day average, and against the same shelf stop that was a 36.5 percent risk. Same day, same chart, roughly double the distance to the stop. The extension from the pivot is the number to check before sizing.
From 465 to 9414: how the BNGO trend played out
The first test came at once. On 24 December the stock fell 9.0 percent to 423, with an intraday low of 393, still well above the pivot. Then it went vertical: 530.52 on 28 December, 798 on 29 December, and 1260 on 30 December on 1,326,494 shares, the heaviest session in the data set and 116.9 times the pre-entry 20-day average. On 4 January it touched 4344 and closed at 4320, 829.0 percent above the first buy.
The offering hit the next week. From the 4344 high the stock fell to a 2346 low on 8 January, a 46.0 percent drop in four sessions, yet it never closed under its 10-day average. A trader watching for a recovery might have noticed the 14 January session, when BNGO traded to 4770, above the 4 January high. That close at 4170 was an opportunity to add, with another 47.1 percent to the exit still ahead. The mechanics are covered in pyramiding into a position.
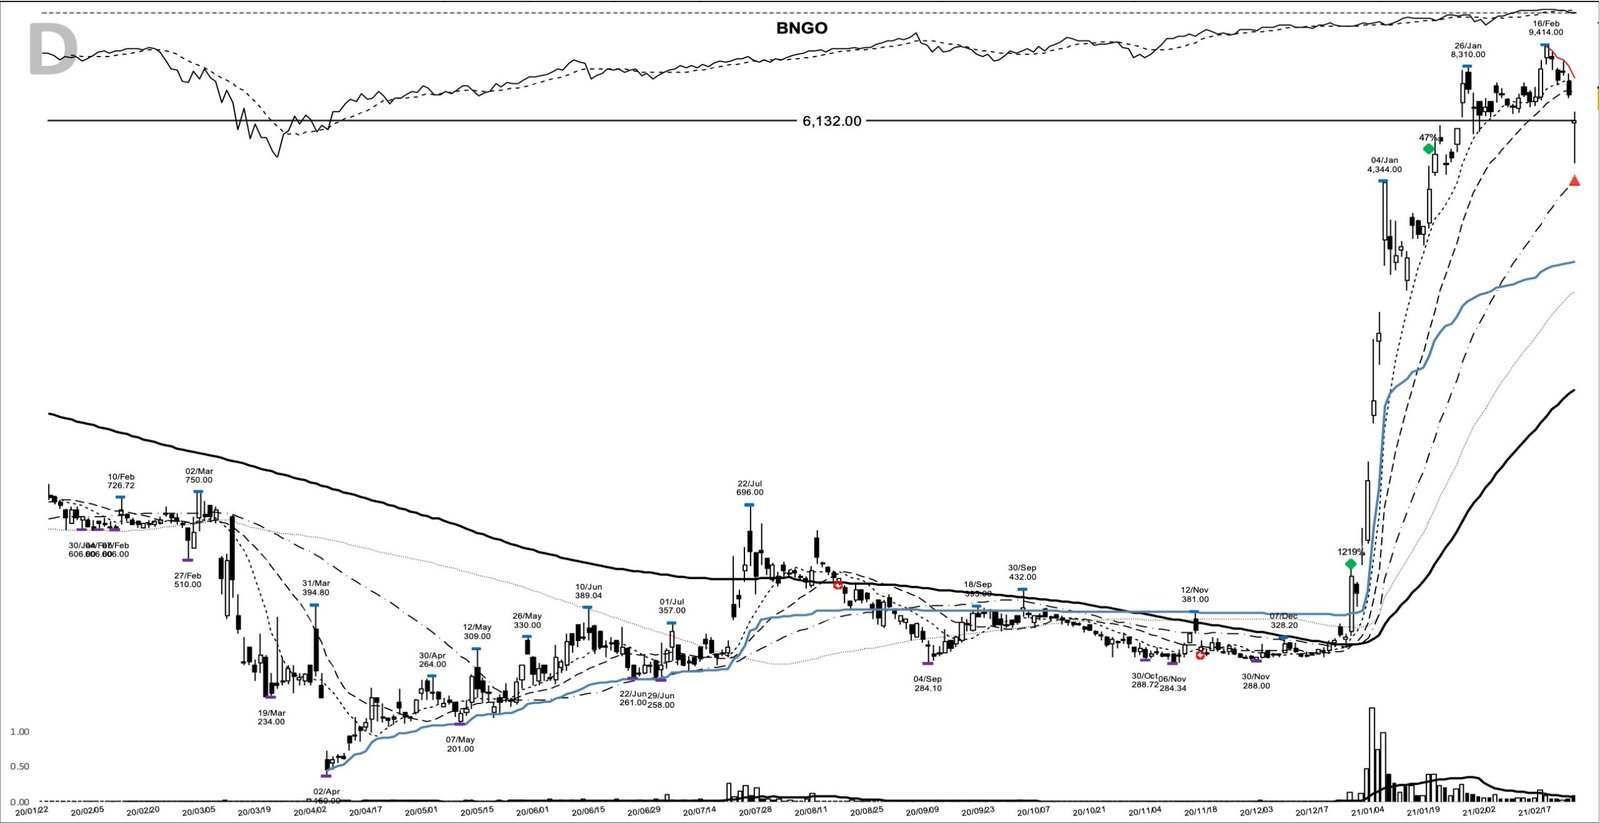
Late January brought highs of 8190 and 8310. The first closes under the 10-day line came on 4 and 5 February, at 6708 and 6630, while the 20-day average sat far below at 5406.6. The trend recovered to a 9414 peak on 16 February.
On 22 February BNGO closed at 7110, its first close under the 20-day average since the entry. The next session it opened at 6066, traded down to 4830 and closed at 6132. That was the exit: 1218.7 percent above the first buy, 62 calendar days later and 34.9 percent under the peak. A thousand dollars riding the full move would have become about 13,200 dollars.
Where the BNGO chart can mislead
The volume multiple is the first trap. Twelve point six times average sounds like heavy institutional demand, but the average was 11,350 split-adjusted shares on a stock trading under 1 dollar in unadjusted terms. The surge says interest arrived. It says little about who was buying, and nothing about whether they would stay.
The second is the fundamental frame. Revenue was falling year over year and the company was losing money, the opposite of the earnings acceleration a growth screen looks for. This setup carried price, volume and a story. A trader treating it as a leader in the classic sense would have been reading the wrong chart.
The third is the tidy look of the run in hindsight. Inside it sat a 46.0 percent drop in four sessions, two financings, and an exit-day low 32.1 percent under the prior close. A position sized for an ordinary breakout would have been hard to hold through any of them.
The last is the headline number. The +1218.7% runs from the first buy to the exit, while the peak sat 1924.5 percent above that close. A 10-day trail would have closed out on 4 February at 6708, higher than the 23 February exit. Neither rule caught the top, and neither was meant to.
What BNGO teaches about speed and the 20-day line
A five-month base that closed 30.3 percent above its pivot on the day it cleared it left almost no room to buy near the pivot, which is why the order type set the risk. After that the 20-day moving average carried the trend from late December to 22 February without a single closing break, and the first one arrived a day before a 4830 low. On a move this fast, the rule written on day one did the work that judgement couldn’t.
Learn the pattern. Ride the trend. Keep the gains.
Related studies: the NTLA base breakout of November 2020, another gene-technology name from the same market, plus the TLRY base breakout of January 2021 from the same speculative winter. For the volume side of the entry bar, see volume confirmation on breakout candles. A new winner study lands most evenings.
Price and volume figures are computed from split-adjusted daily OHLCV data; company figures come from SEC filings where cited.
Educational content only. Not investment advice. Trading involves risk. You are responsible for your decisions.
Get the free Market Wisdom e-book
Join Trends and Breakouts — historical winners, breakout studies, and risk lessons. No spam, unsubscribe anytime.