AMR is back among the day’s biggest gainers, which makes this a good moment to pull the chart that turned a forgotten coal miner into a textbook base breakout. In December 2020 the stock was a small, beaten-down cyclical trading under 9 dollars, quietly building a shelf after a brutal two-year decline. The AMR base breakout on 7 December 2020 cleared an 8.71 pivot on heavy volume and became the launch bar for a 1,526 percent advance that ran 553 calendar days, from an 8.99 close to a 146.18 exit.
That is the whole arc in one sentence. The rest of this study is about why the shelf was worth watching, how the breakout confirmed, and what a trend follower could have done with the year and a half that followed. The charts here come from my study archive.
Key takeaways from the AMR base breakout
- The setup was a base breakout: a deep six-month base, roughly 73 percent from high to low, resolving through an 8.71 pivot.
- The entry day, 7 December 2020, closed at 8.99 on volume running 2.8 times the 20-day average.
- The run measured 1,526 percent from that 8.99 close to the 146.18 exit on 13 June 2022, over 553 calendar days, with a 186.98 peak on 7 June 2022.
- The chart offered eight marked add-on points on the way up, from an 11.94 close in January 2021 to a 120.64 close in March 2022.
- Price and volume led a metallurgical-coal earnings recovery that the trailing fundamentals had not yet shown. That gap is the lesson.
The AMR trade at a glance
| Field | Value |
|---|---|
| Ticker | AMR |
| Breakout date | 7 December 2020 |
| Breakout close | 8.99 |
| Volume vs 20-day average | 2.8x |
| Exit date | 13 June 2022 |
| Exit close | 146.18 |
| Gain | +1,526% |
| Calendar days held | 553 |
| Peak before exit | 186.98 (7 June 2022) |
How the AMR base breakout took shape
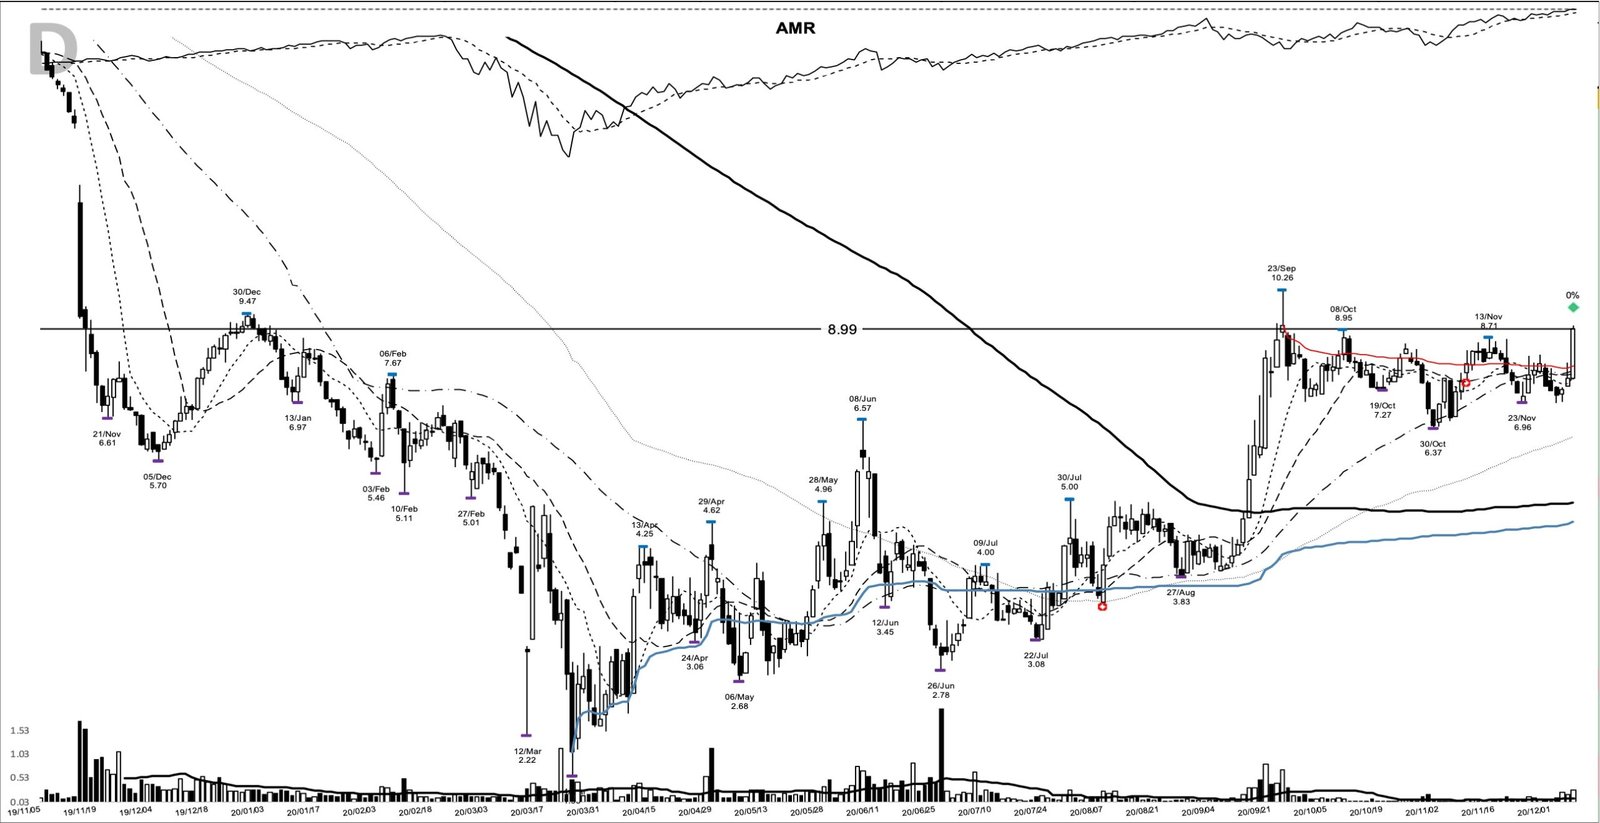
The base ran about six months. The low was a 2.78 print on 26 June 2020, deep in the COVID wreckage, and the base high was 10.26 on 23 September 2020, which put the whole structure roughly 73 percent from high to low. That is a wide, damaged base, and price spent the autumn of 2020 grinding sideways along a shelf between the low-7s and the high-8s.
The pivot that mattered was 8.71, the 20-day high set on 13 November 2020. On 7 December 2020 the stock opened at 7.60, traded up to a 9.10 high, and closed at 8.99. That close finished above the 8.71 pivot, which is what makes this a confirmed breakout rather than a probe: the bar closed through the level instead of poking at it. Volume did the confirming work, printing 287,088 shares against a 101,157-share 20-day average, or 2.8 times normal. When you are reading volume on a breakout, that expansion is the tell you want.
The base breakout is the pattern William O’Neil built a career around, and this is a clean example of it. At the entry, though, the earnings gave no reason to buy. The most recent quarter on file was a 3.75-dollar per-share loss for the period ending 30 September 2020, with revenue still falling year over year. Price moved first, and the business case caught up more than a year later.
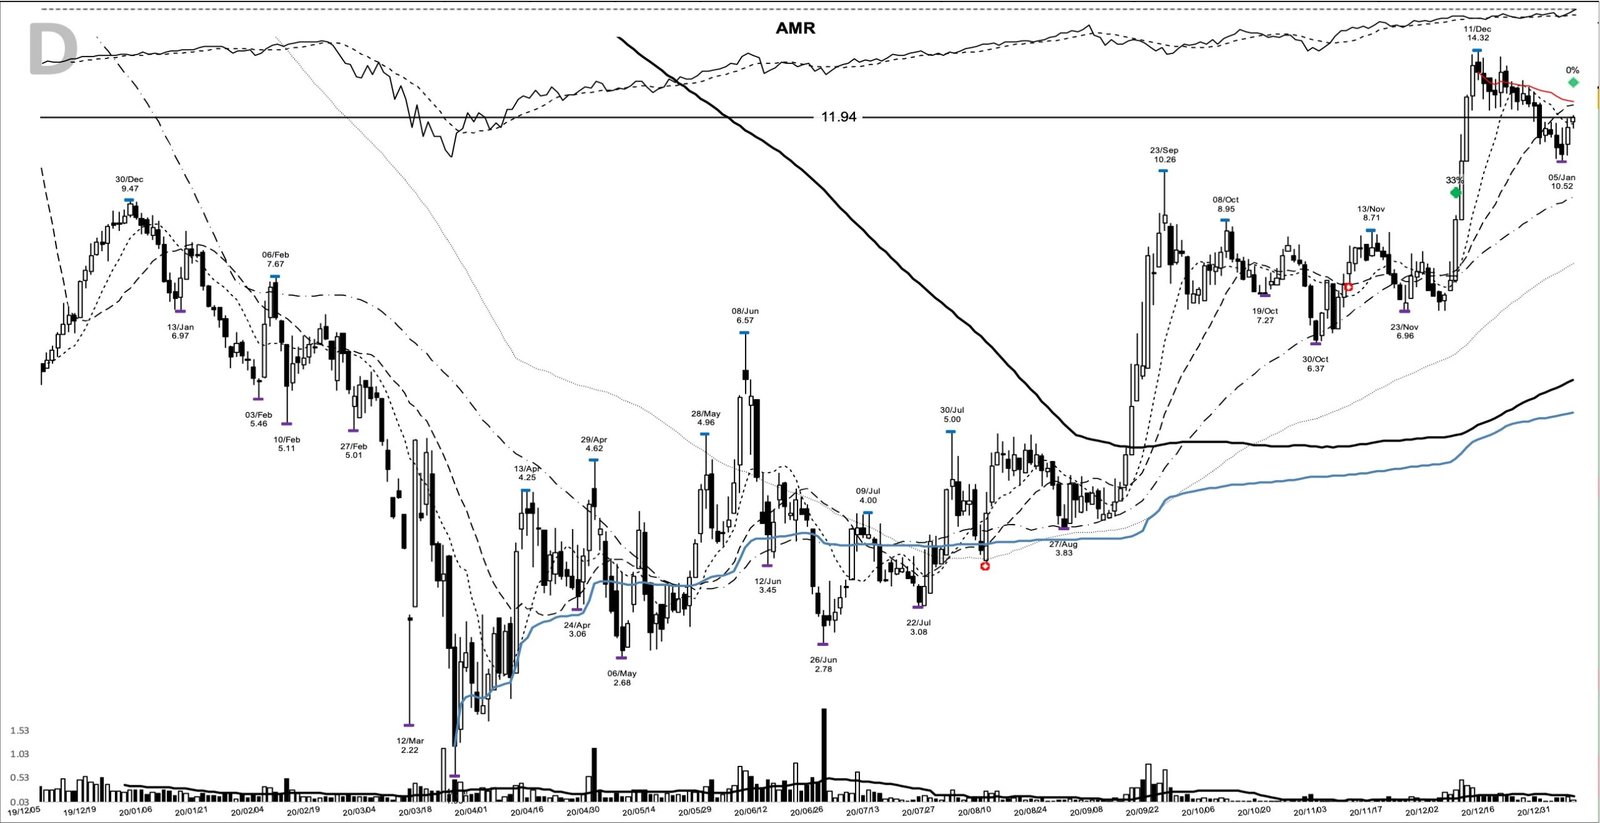
The company behind the ticker, then trading as Contura Energy
At the December 2020 breakout, this business traded under a different name. It was Contura Energy, and it renamed itself Alpha Metallurgical Resources effective 1 February 2021, with the ticker changing from CTRA to AMR a few days later. The rebrand followed the sale of its thermal-coal mine and signalled a pure focus on metallurgical coal, the coking coal that feeds steelmaking.
The fundamentals into the breakout were still ugly, but the worst appeared to be passing. The quarterly loss had narrowed from 13.02 dollars per share in the June 2020 quarter to 3.75 dollars by September, and the year-over-year revenue decline had eased from about 46 percent to 36 percent over the same stretch. A bottom was forming in the numbers while the base was forming on the chart.
Then the commodity turned hard. Through 2021 coking-coal benchmarks roughly tripled, with one US East Coast index climbing from about 193 dollars a metric ton at the start of the third quarter to 377 dollars by the end of September. That price surge is what converted a narrowing loss into the huge profits that arrived in 2022, and it is why a chart that broke out on ugly trailing numbers went on to run so far.
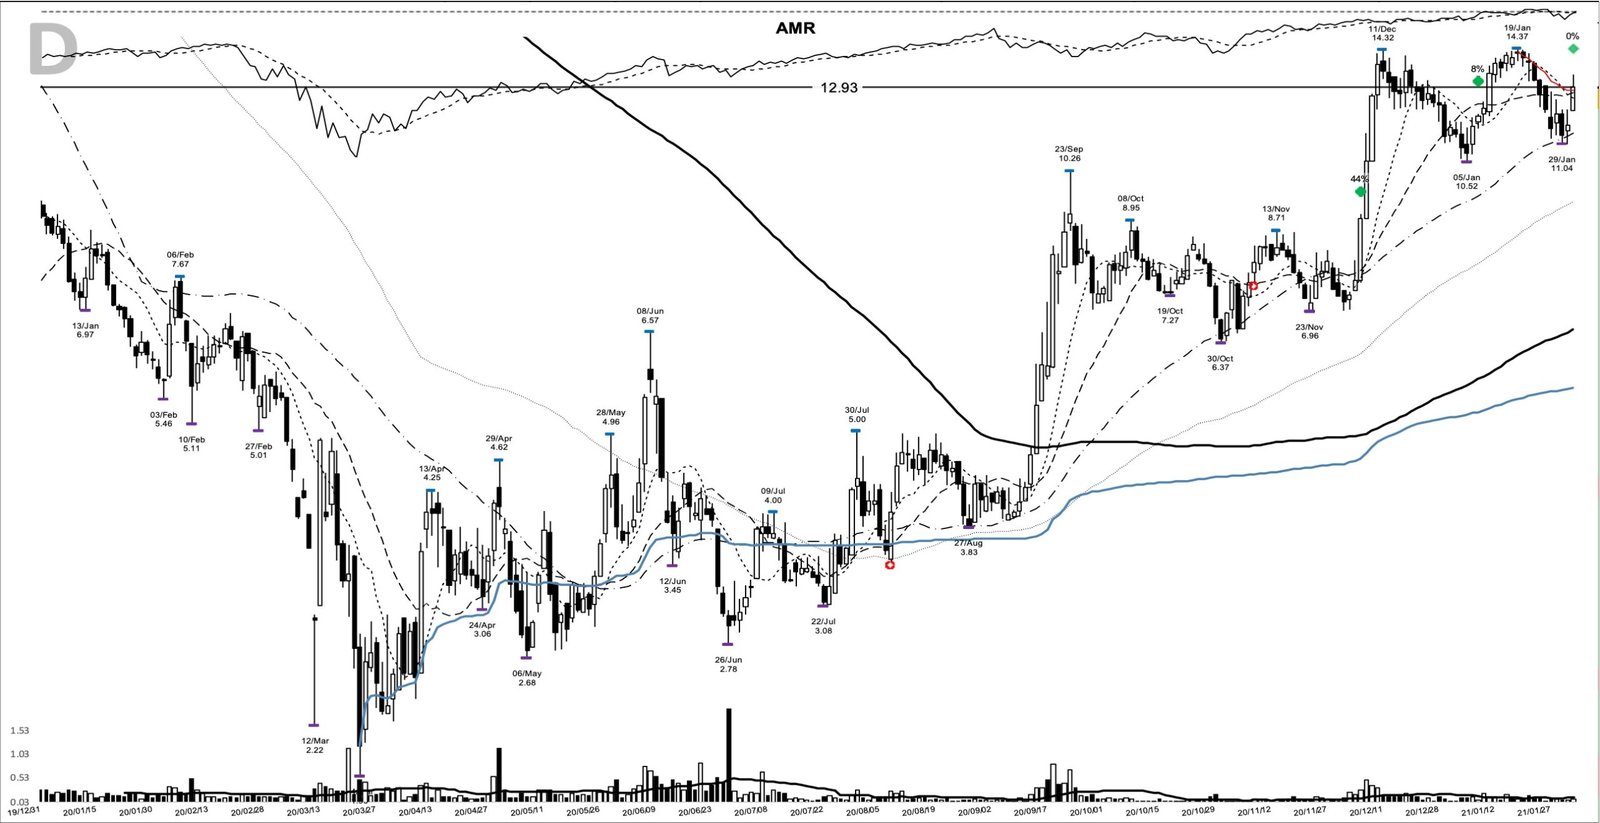
The late-2020 tape that rewarded beaten-down cyclicals
The breakout did not happen in a vacuum. Late 2020 was a confirmed uptrend, and the character of that tape mattered here. The November 2020 vaccine news had triggered a rotation out of stay-at-home technology and into beaten-down cyclicals and small caps, the reflation trade. AMR was exactly that kind of name: a tiny, cyclical, left-for-dead miner, breaking out into a market that had suddenly started paying up for economic-recovery plays. When the broad tape leads the advance instead of merely tolerating it, a breakout has the wind behind it.
How a trader could have prepared for the 8.71 pivot
Preparation here was mechanical, and the structure told you where to draw the lines. Into the entry the stock had turned up through its moving averages: the 7 December close sat about 18 percent above its 10-day line, and it had closed above that 10-day for two straight sessions. On the chart, a long moving average that had sloped down for most of 2020 had flattened out under price, and a relative strength line along the top of the panel had recovered from its March 2020 collapse. That flattening base under a stock reclaiming its averages is the classic stage-two handoff.
The watchlist trigger was the 8.71 pivot, the 20-day high from 13 November. The recent shelf low was 6.98, printed on 2 December, and the base low beneath everything was that 2.78 from June. So the plan a trend follower could have written that day is simple: a buy on a close above the 8.71 pivot, an initial stop below the 6.98 shelf, and from there a trailing stop under the rising 10-day moving average, widened to the 20-day once the position was well advanced. That is a defined-risk entry with the danger point marked before the first share is bought.
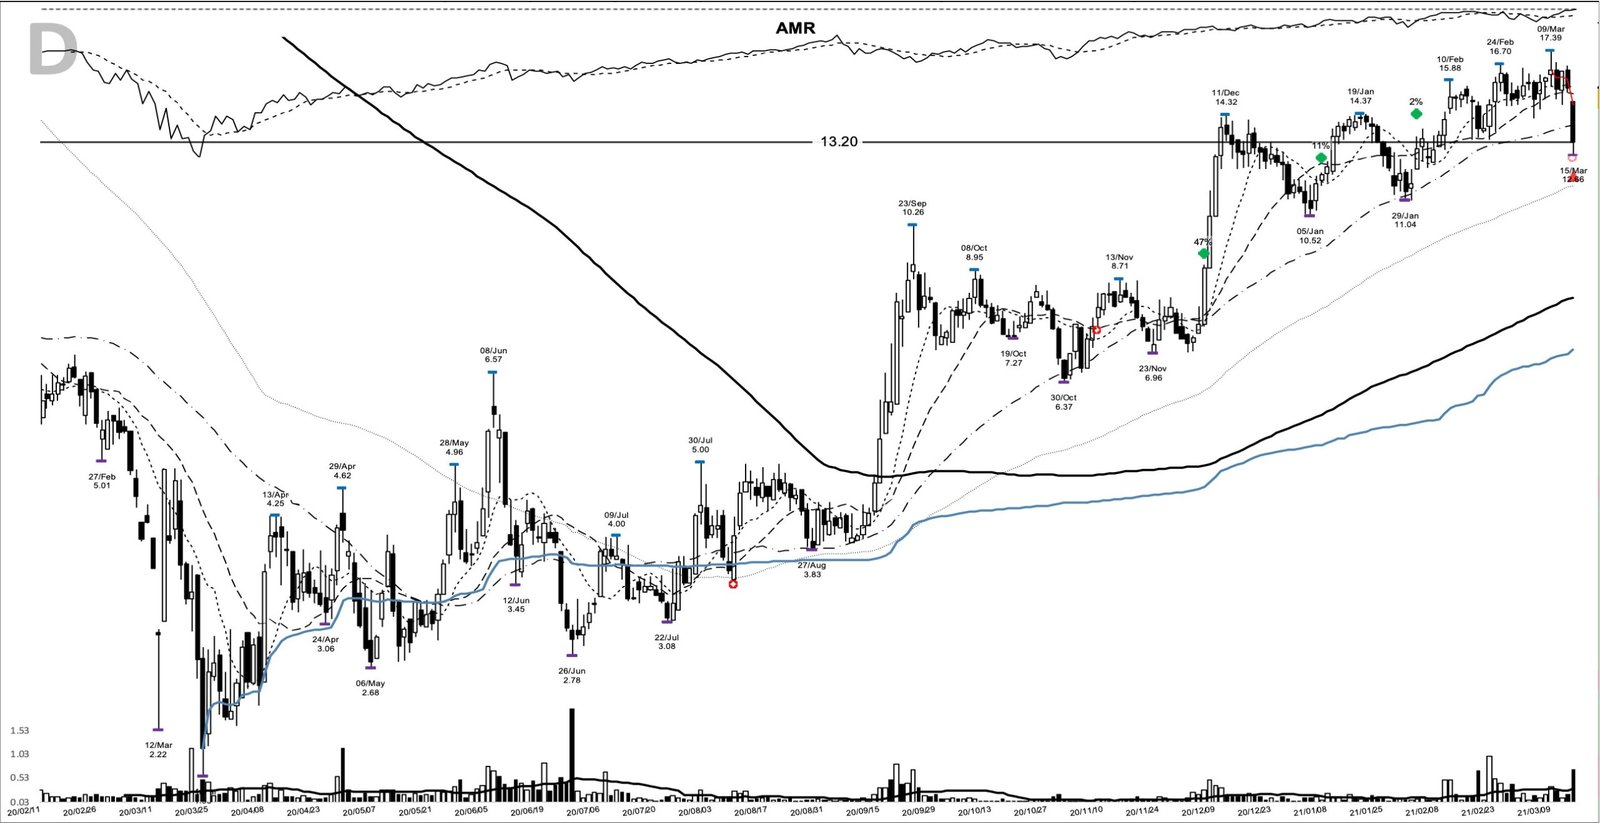
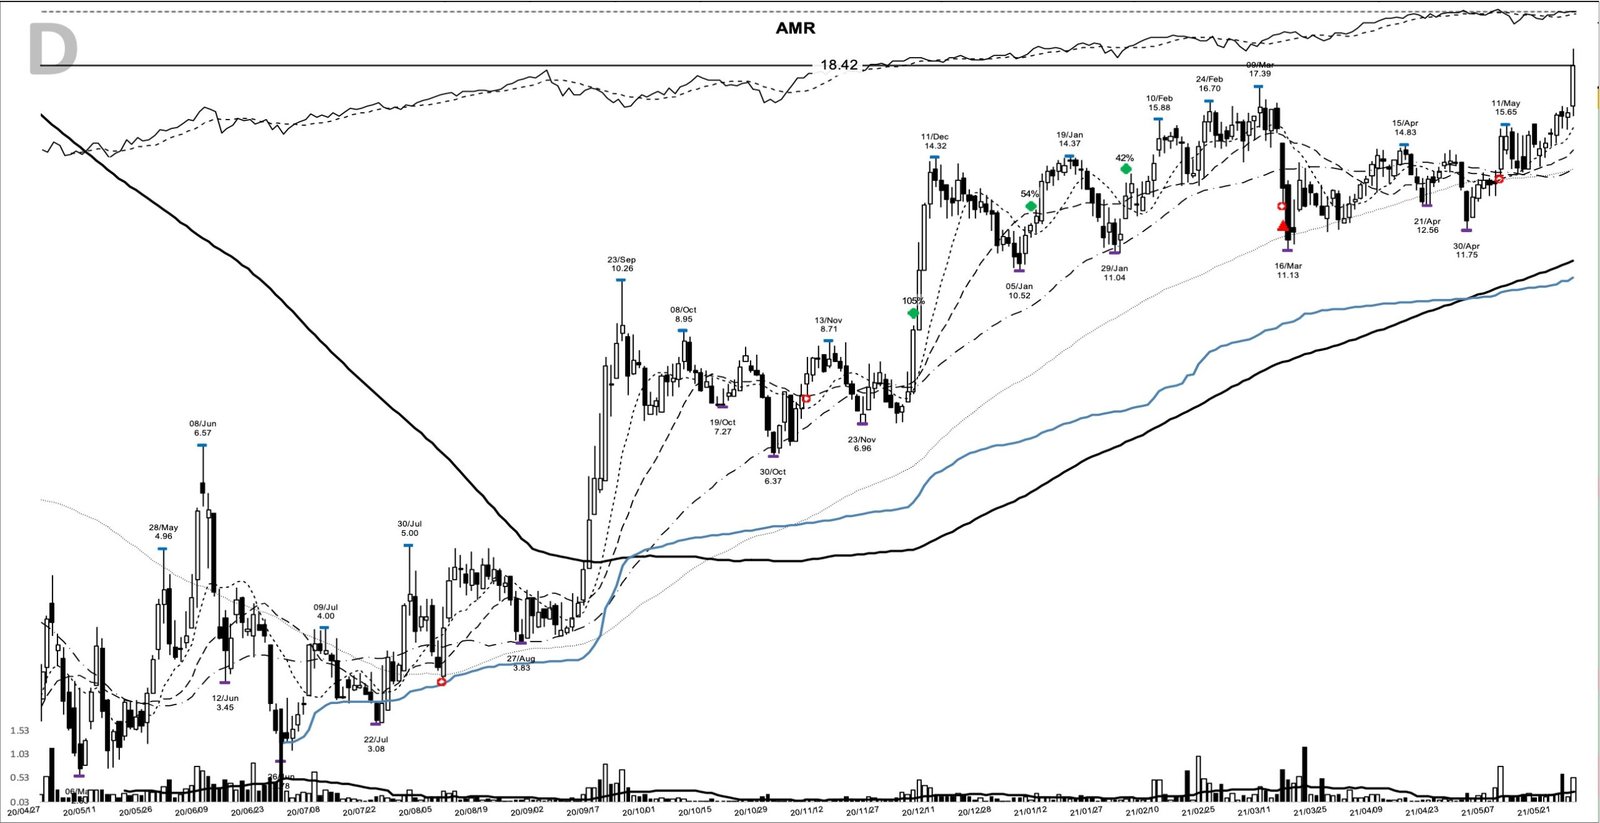
What the AMR trend delivered after December 2020
A trader using this pattern might have watched for the trend to hold above the rising averages and used strength to build size. The follow-through was immediate: the two sessions after the entry closed at 10.55 and 12.61, and price never looked back to the pivot.
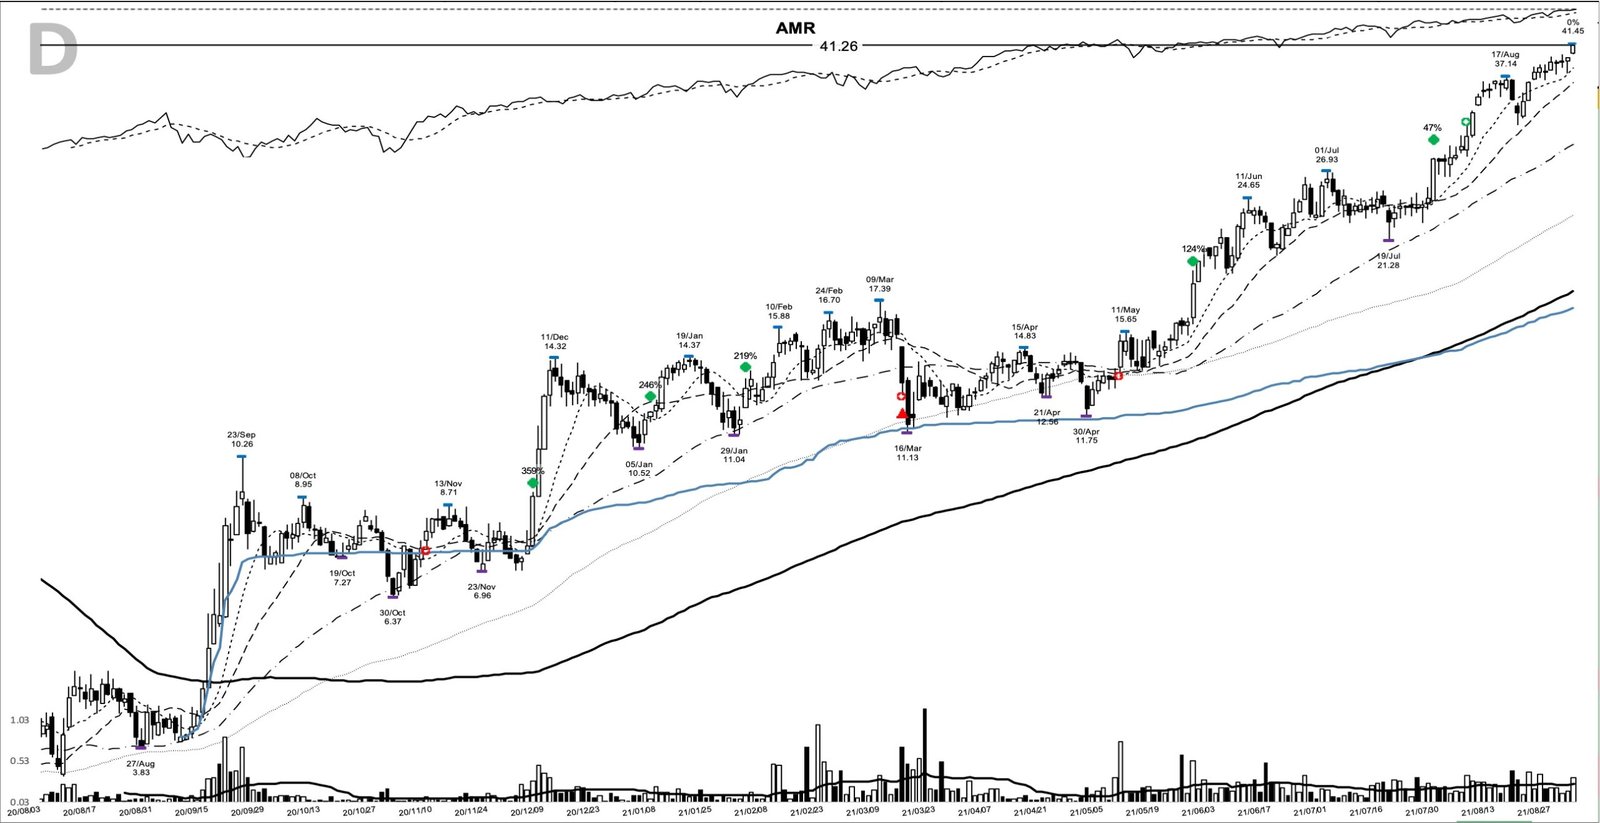
From there the tape handed out repeated add-on points, each one higher and each one confirming the last. There were opportunities to add near an 11.94 close in January 2021, a 12.93 close in February, an 18.42 close in May, and a 28.09 close in July. This is the pyramiding idea in action, and it is the heart of trend following: press a winner while the structure stays intact.
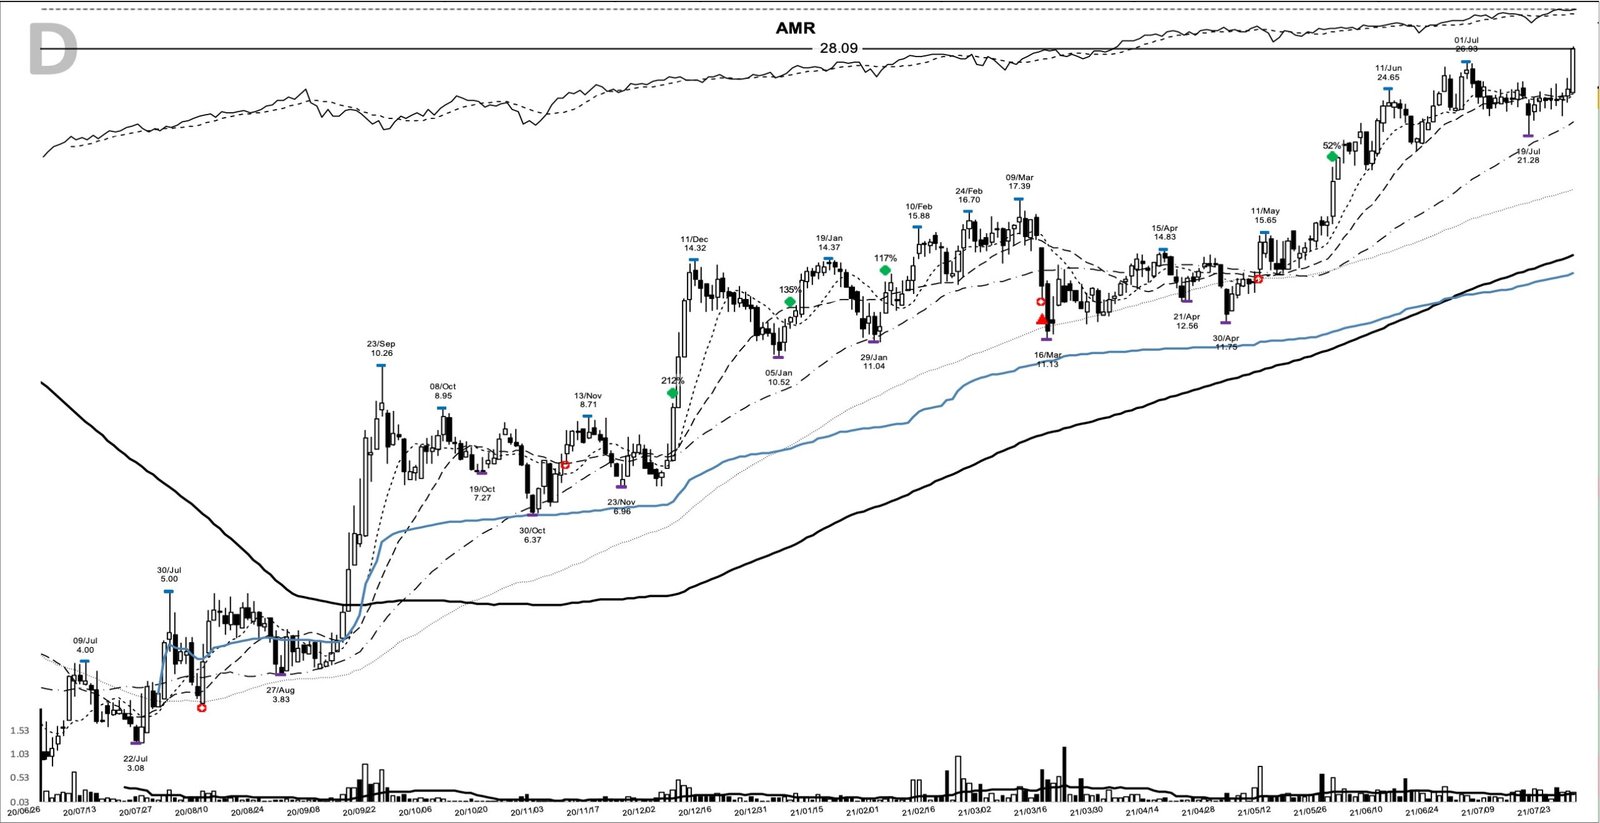
By early September 2021 the stock closed at 41.26, up 359 percent from the 8.99 entry, and the trend was still climbing. A 55.62 close arrived in October. The advance paused into November, then resumed toward a 73.63 close in February 2022 and a 120.64 close in March, the point at which the stock had already gained more than 1,200 percent from the breakout.
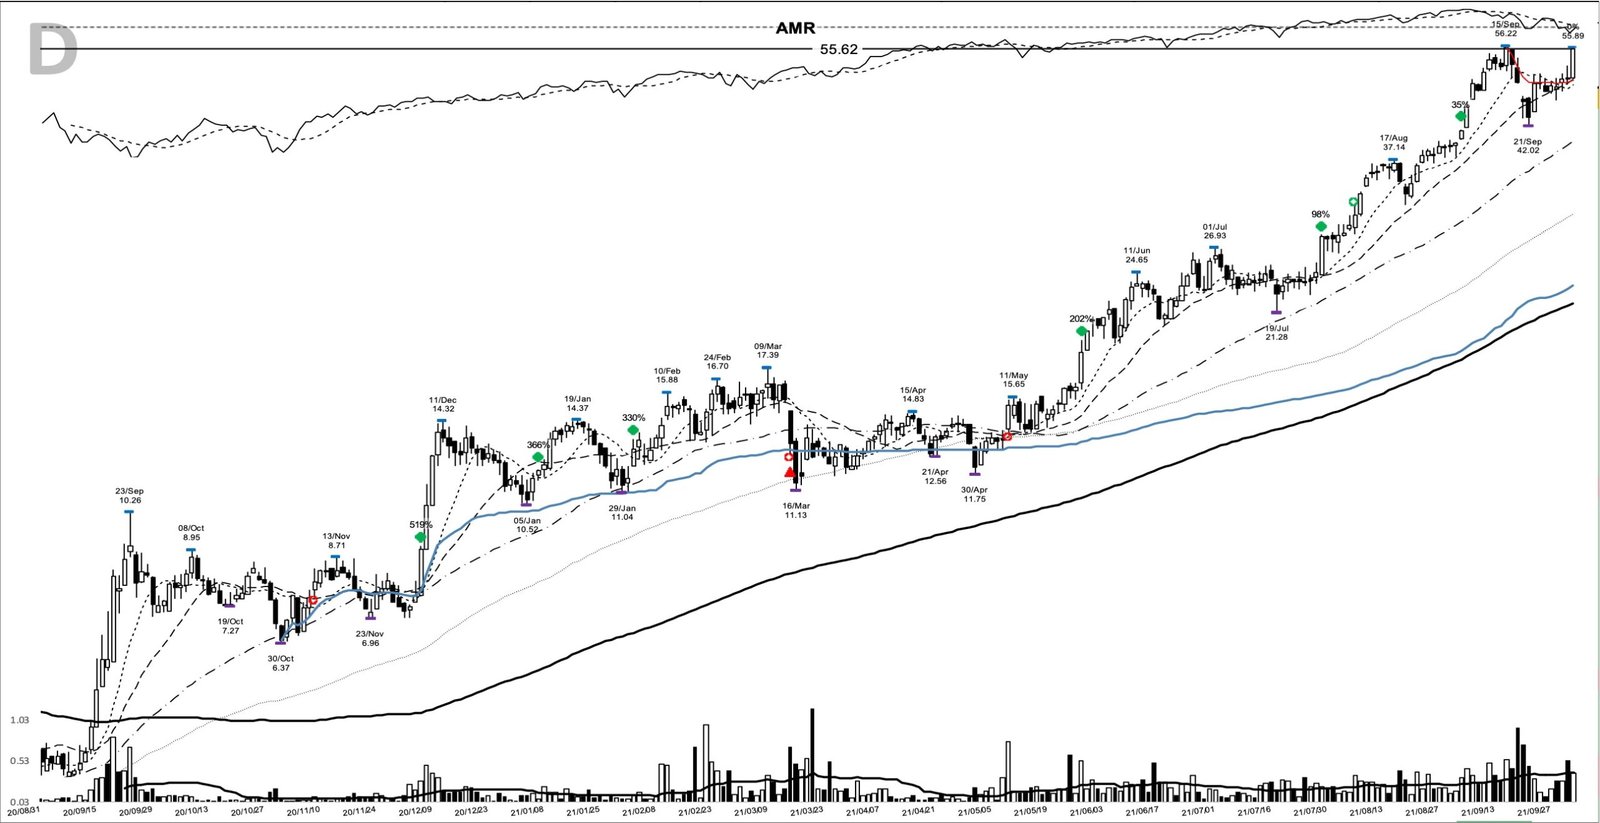
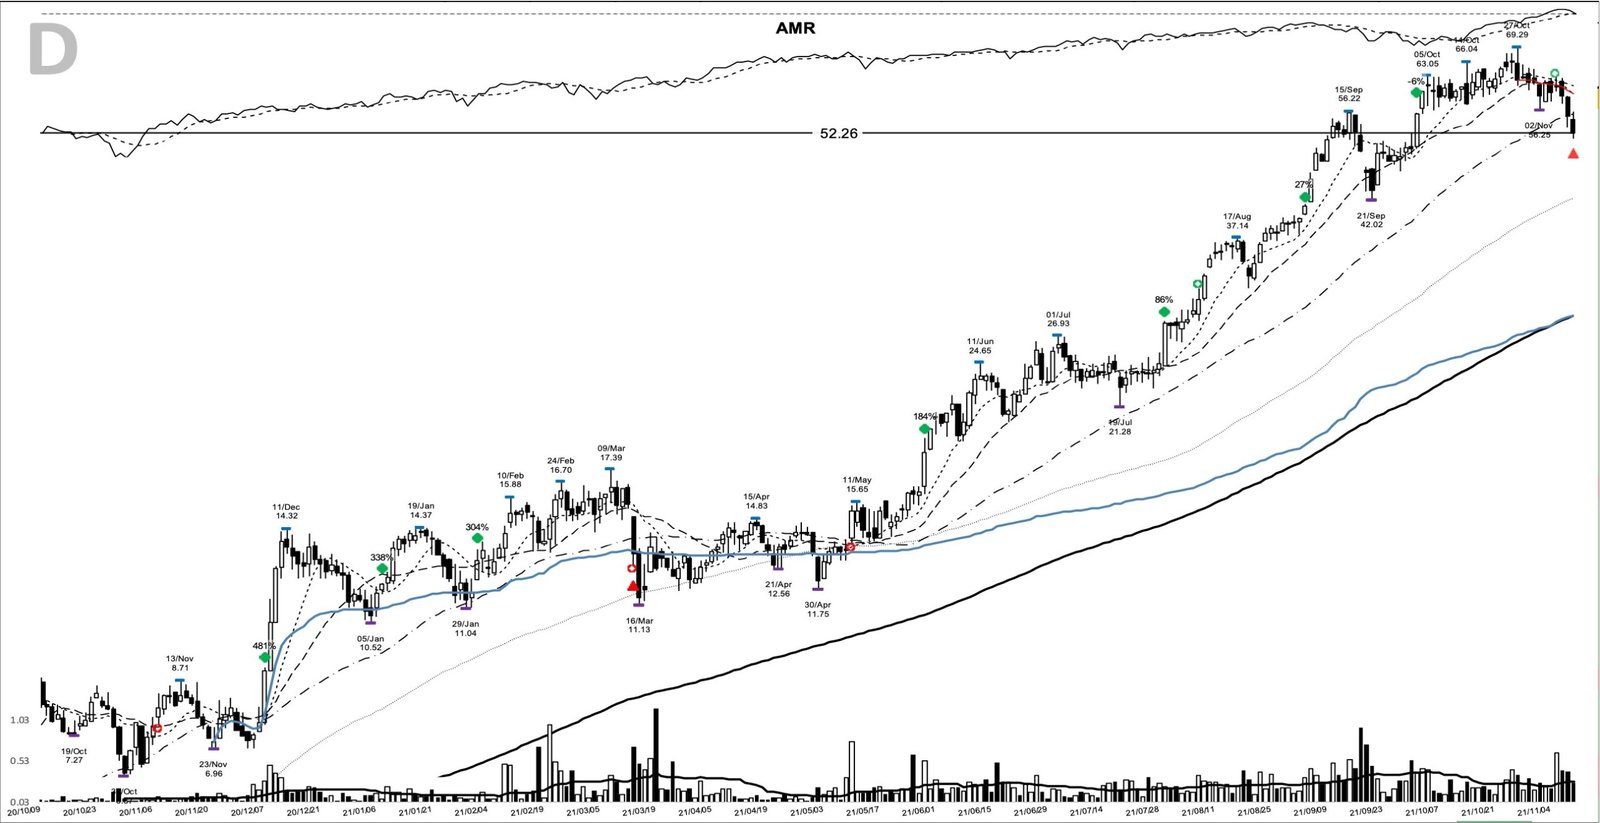
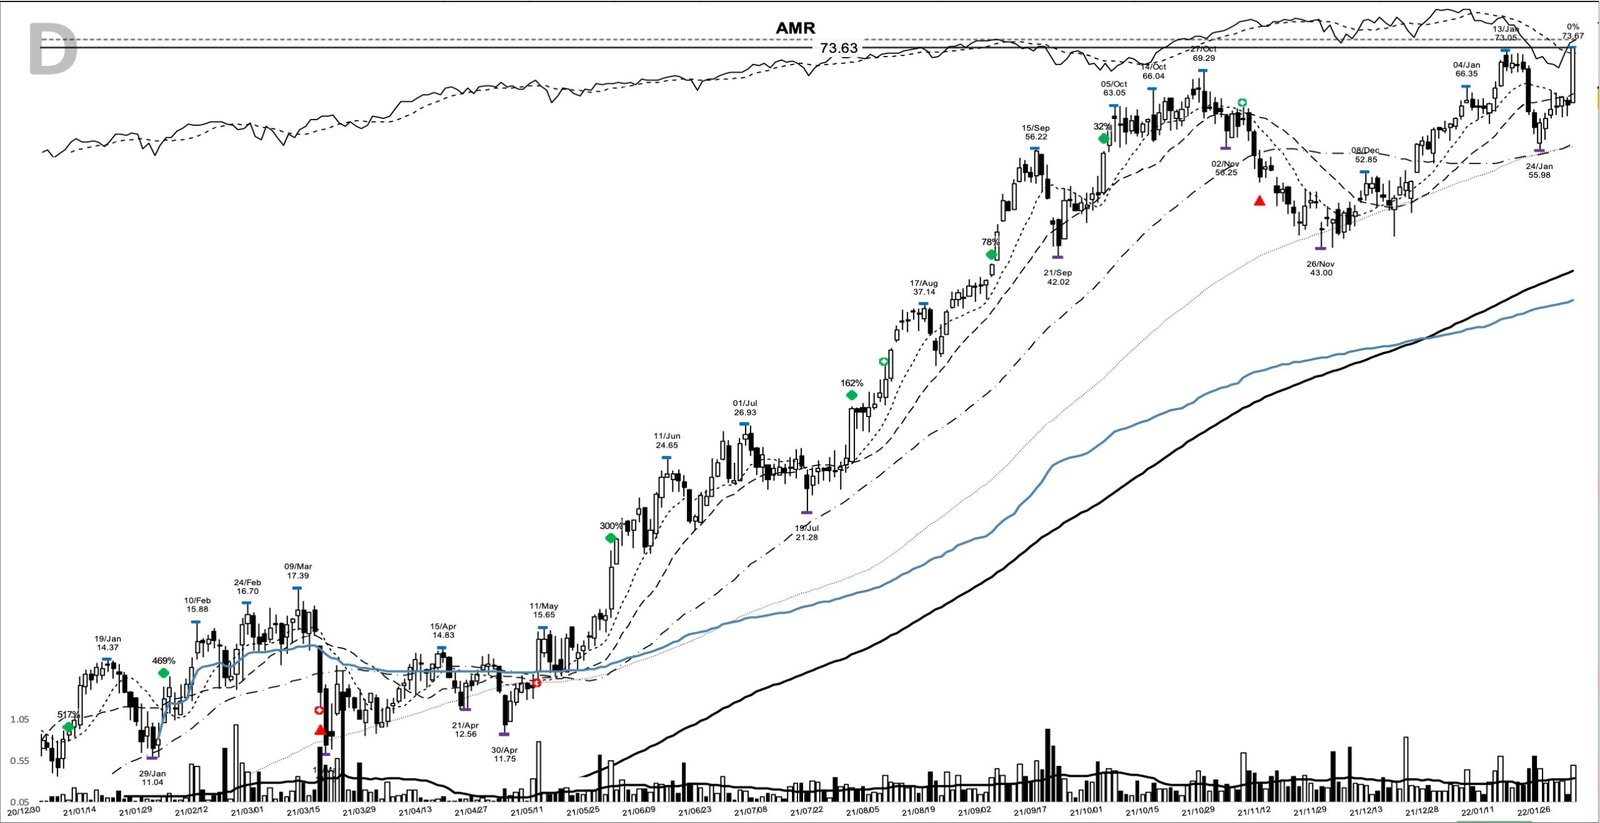
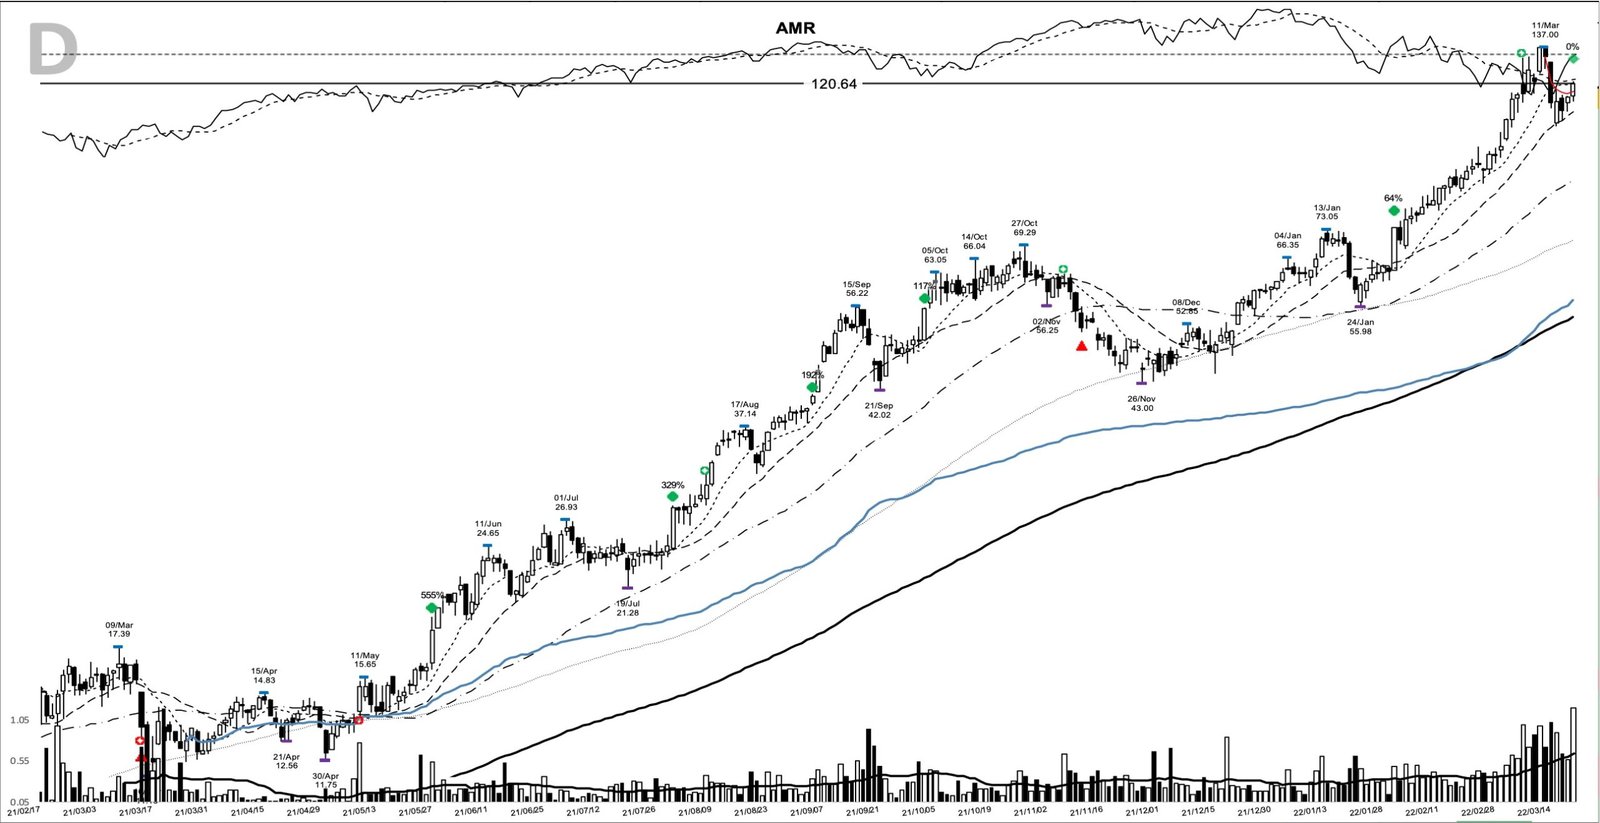
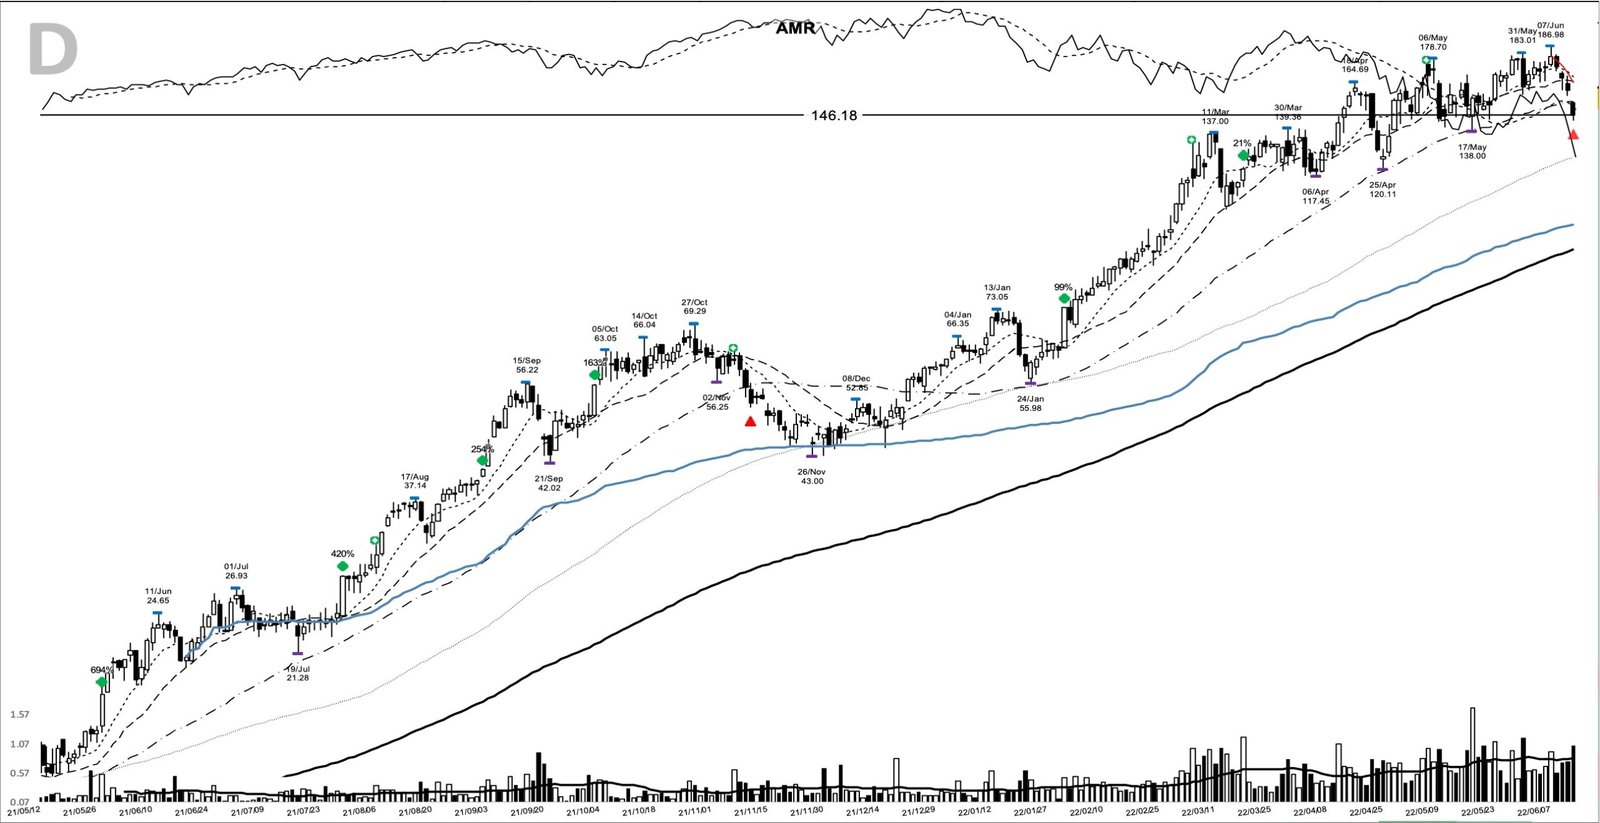
The high came at 186.98 on 7 June 2022, and the marked exit landed at a 146.18 close on 13 June, a 1,526 percent gain from the entry over 553 calendar days. Put in plain money terms, 1,000 dollars riding the full move would have become about 16,260 dollars. The number is huge, but the mechanics behind it were ordinary: enter on the confirmed pivot, add on strength, and trail the trend until it broke.
Where the AMR base breakout could have shaken you out
The clean hindsight arc hides how uncomfortable the trade was to hold. A base this deep, down roughly 73 percent inside six months, carries heavy overhead supply from every trapped buyer above. That overhead is why the pivot needed a decisive close and expanding volume before the setup earned attention; a shallow poke through 8.71 on quiet volume would not have qualified.
The fundamentals were the second trap, in the other direction. A checklist demanding positive earnings growth would have thrown AMR out on sight, because the company was still losing money at the breakout. The chart led the recovery by more than a year, and a purely fundamental screen would have missed the entire move.
Then came the shakeouts. The pullback to a 13.20 close in March 2021 and the deeper stall to a 52.26 close in November 2021 each looked, in the moment, like the top. Selling into either would have cut the trend off before the 120.64 and 146.18 prints. The entry also sat about 12 percent below the stock’s 52-week high of 10.26, so this was a shelf breakout inside a longer basing structure, not a fresh all-time-high launch. The pattern promised a defined-risk entry and a trend to follow, nothing more.
Learn the pattern, then let the coal cycle run
The AMR base breakout is a reminder that the best trend trades often look worst on paper at the entry: a broken cyclical, negative earnings, a deep and damaged base. The chart said what the income statement could not yet say, and the discipline that captured the move was ordinary, repeatable trend following. Learn the pattern. Ride the trend. Keep the gains.
Related studies: TSLA base breakout, November 2019, MARA base breakout, October 2020, and QS base breakout, November 2020. A fresh winner study lands here most evenings.
Price and volume figures are computed from split-adjusted daily OHLCV data; company figures come from SEC filings where cited.
Educational content only. Not investment advice. Trading involves risk. You are responsible for your decisions.
Get the free Market Wisdom e-book
Join Trends and Breakouts — historical winners, breakout studies, and risk lessons. No spam, unsubscribe anytime.