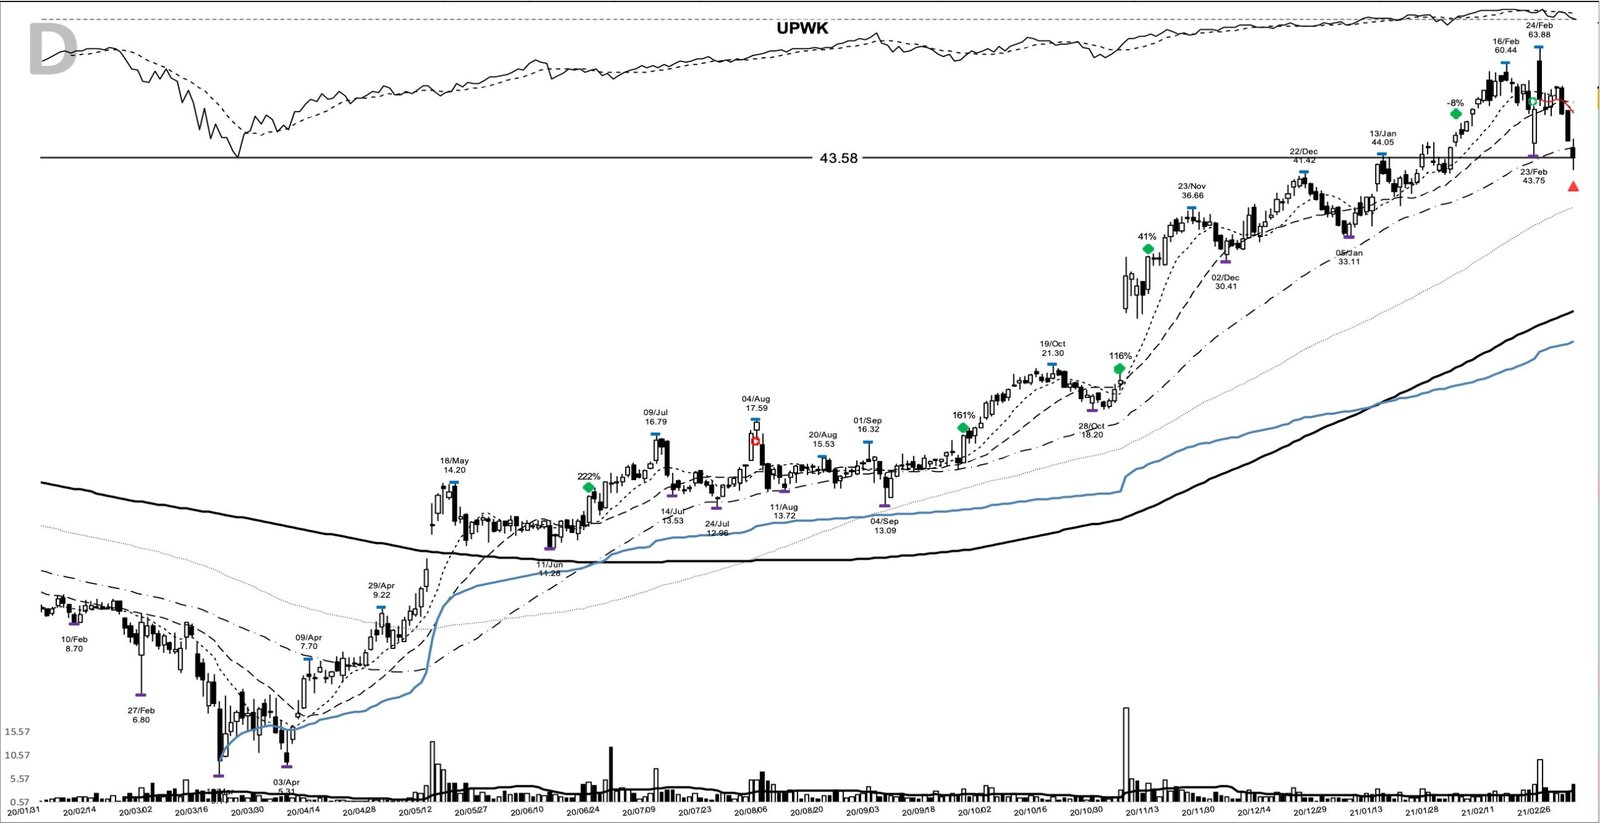
In June 2020, UPWK cleared a well-defined pivot and kept climbing. Upwork broke out of a six-month base at a close of 13.55, then trended to a 43.58 close on 4 March 2021, a gain of 221.6% held over 255 calendar days. Upwork’s trending again this week, which puts the UPWK base breakout back on the list of charts worth studying.
The stock’s in the headlines after a sharp post-earnings move, and a trending ticker’s a good prompt to pull up its defining chart. The 2020 base is the one worth pulling up, because it shows what a genuine leadership breakout looked like from the same name, and how a trend could be held for months.
Key takeaways from UPWK’s June 2020 base breakout
- UPWK broke out of a six-month base on 22 June 2020 at a close of 13.55, clearing the 12.85 pivot on volume about 2.2 times its 20-day average.
- Revenue was growing near 21% year over year into the entry, and the remote-work shift was turning into a durable tailwind for a freelancing marketplace.
- The move ran 221.6% over 255 calendar days to a 43.58 close, and peaked at 63.88 before the exit.
- Higher-low continuation points on 25 September, 4 November, and 11 November 2020 gave repeated chances to add as the trend confirmed.
- The lesson is a trend-following one: size a leader at the pivot, then let the trend do the work instead of forecasting the top.
The UPWK trade at a glance
| Item | Value |
|---|---|
| Ticker | UPWK |
| Breakout date | 22 June 2020 |
| Breakout close | 13.55 |
| Volume vs 20-day average | 2.2x |
| Exit date | 4 March 2021 |
| Exit close | 43.58 |
| Gain | 221.6% |
| Calendar days held | 255 |
| Peak before exit | 63.88 on 24 February 2021 |
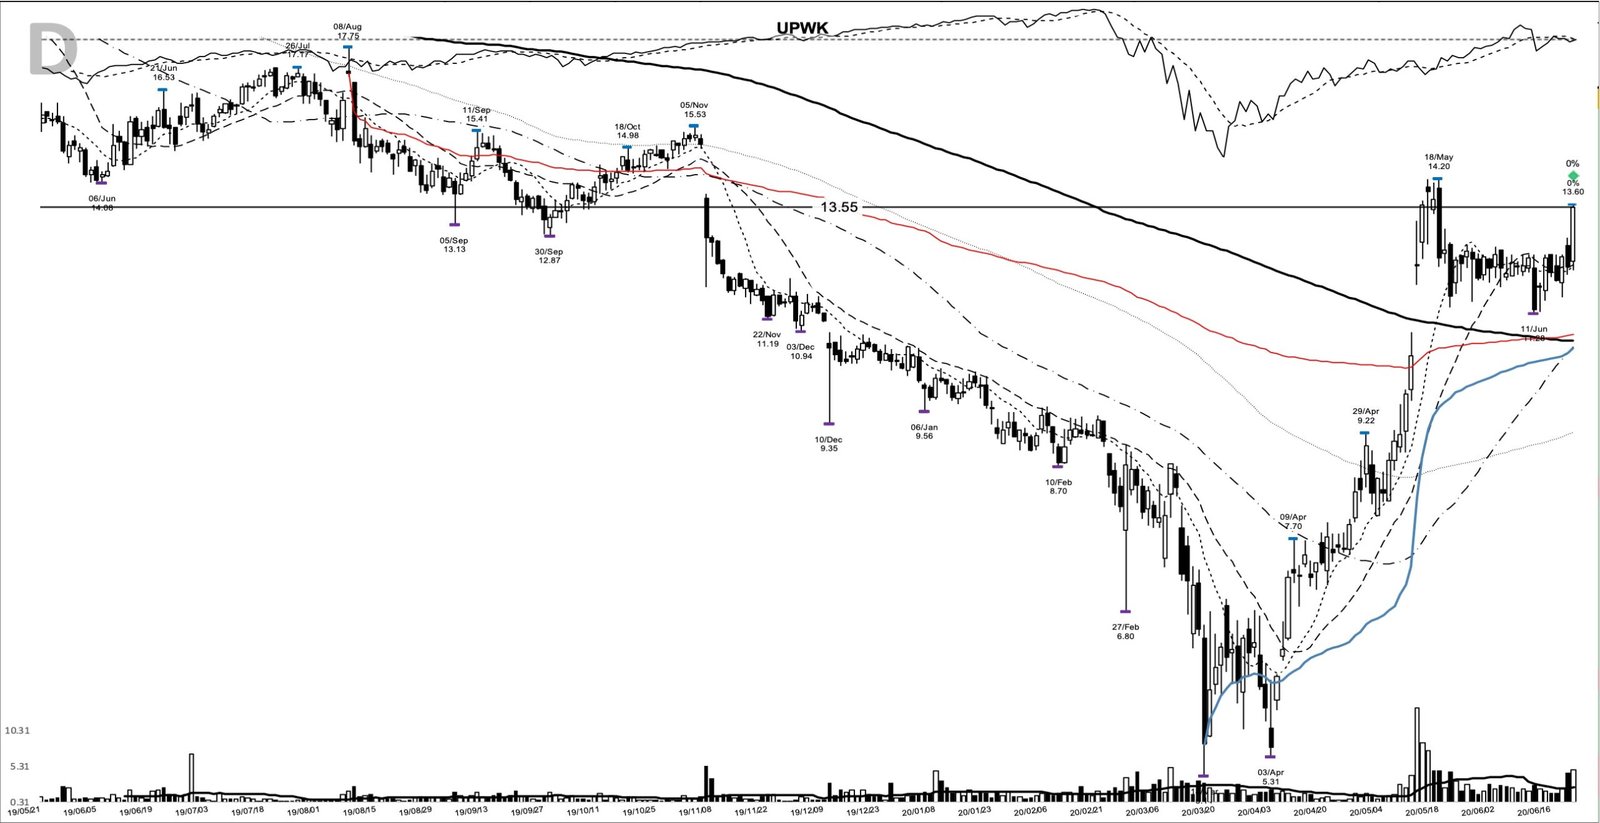
Anatomy of the UPWK base breakout
This is one of the charts in my study archive, and it’s about as clean as a base gets. Upwork fell from a 17.75 high in August 2019 to a 5.14 low on 18 March 2020, then recovered into a six-month base that topped near the 14.20 high of 18 May 2020. That base ran 63.8% deep, and it’s worth stating plainly: a deep, V-shaped recovery base is lower quality than a flat, tight one, and it carries more room to fail.
The pivot was the prior 20-day high at 12.85, set on 19 June 2020. On 22 June the stock opened at 12.35, pushed to a 13.60 high, and closed at 13.55, a clean close above the pivot. Volume printed 4,791,793 shares against a 20-day average near 2,217,664, roughly 2.2 times normal. A breakout that clears a pivot on a real volume expansion, that’s the version worth respecting, and reading volume against the recent average is how you separate it from a quiet drift through resistance.
The fundamental frame fit the price action. Revenue had grown near 21% year over year into the entry, steady and slightly re-accelerating off the prior year. Price clearing a pivot while the business behind it is compounding is the combination that tends to precede the longest trends.
What Upwork’s business looked like into the breakout
Upwork runs a marketplace that connects companies with freelancers, and it had come public in October 2018. Into the June breakout, its most recent quarter reported revenue of about 83.2 million dollars, up roughly 21% year over year, with gross margin expanding. Growth had been steady in the high teens to low twenties across the prior year, the accelerating profile that a base-and-breakout playbook like William O’Neil looks for behind a leader.
The story investors were arguing about was remote work. When the pandemic sent companies home in early 2020, hiring flexible, distributed talent went from a niche to a boardroom priority, and Upwork’s management pointed to exactly that shift on its spring earnings call. A freelancing platform was suddenly on the right side of a structural change in how work gets done, which gave the chart a narrative to trend on.
The market backdrop in the summer of 2020
The tape helped. By late June 2020 the broad market had recovered most of the February and March crash, and money was rewarding growth, software, and anything tied to the work-from-home theme. Leadership was narrow and momentum-driven, the kind of backdrop where a clean breakout in a strong name tends to follow through instead of fading. A breakout fights the tape far less often when the general market’s trending up alongside it.
The timing had one wrinkle: the entry came during an ordinary pullback in that uptrend, the churn around a big round number on the Nasdaq, and the sensible reading of such dips was that the trend and the light distribution outweighed the turbulence. A base entry taken calmly inside a pullback beats one chased three days later, provided the level and the stop are already written down.
How a trend follower could have prepared for the UPWK entry
The setup was watchable well before 22 June. Price had closed above its 10-day moving average for three straight sessions into the pivot, the 10-day (12.26) and 20-day (12.28) lines had flattened and turned up together, and price sat above a rising 50-day line at 10.68. On the breakout the close was about 10.5% above the 10-day, extended but not wildly so. The base gave two clean reference points: the 12.85 pivot overhead and the 11.56 shelf low from 15 June just beneath it.
From there the plan writes itself. Enter on a close above the 12.85 pivot. Set the initial stop below the 11.56 shelf, or wider below the 5.14 base low where the whole structure would’ve failed. Then trail the advance against the 10-day line, widening to the 20-day once the move is well ahead, so that normal pullbacks don’t shake you out of a trend that’s still intact. That’s the core of a trend-following approach: define where you’re wrong, then give a working trend room to run.
How the UPWK trade played out into 2021
A trader using this pattern might’ve watched the first pullback closely, and it came fast. After the breakout, price ran to a 16.41 close on 9 July, then slid back to a 13.40 close on 24 July, a full round trip to the breakout level. That test held, and the trend resumed.
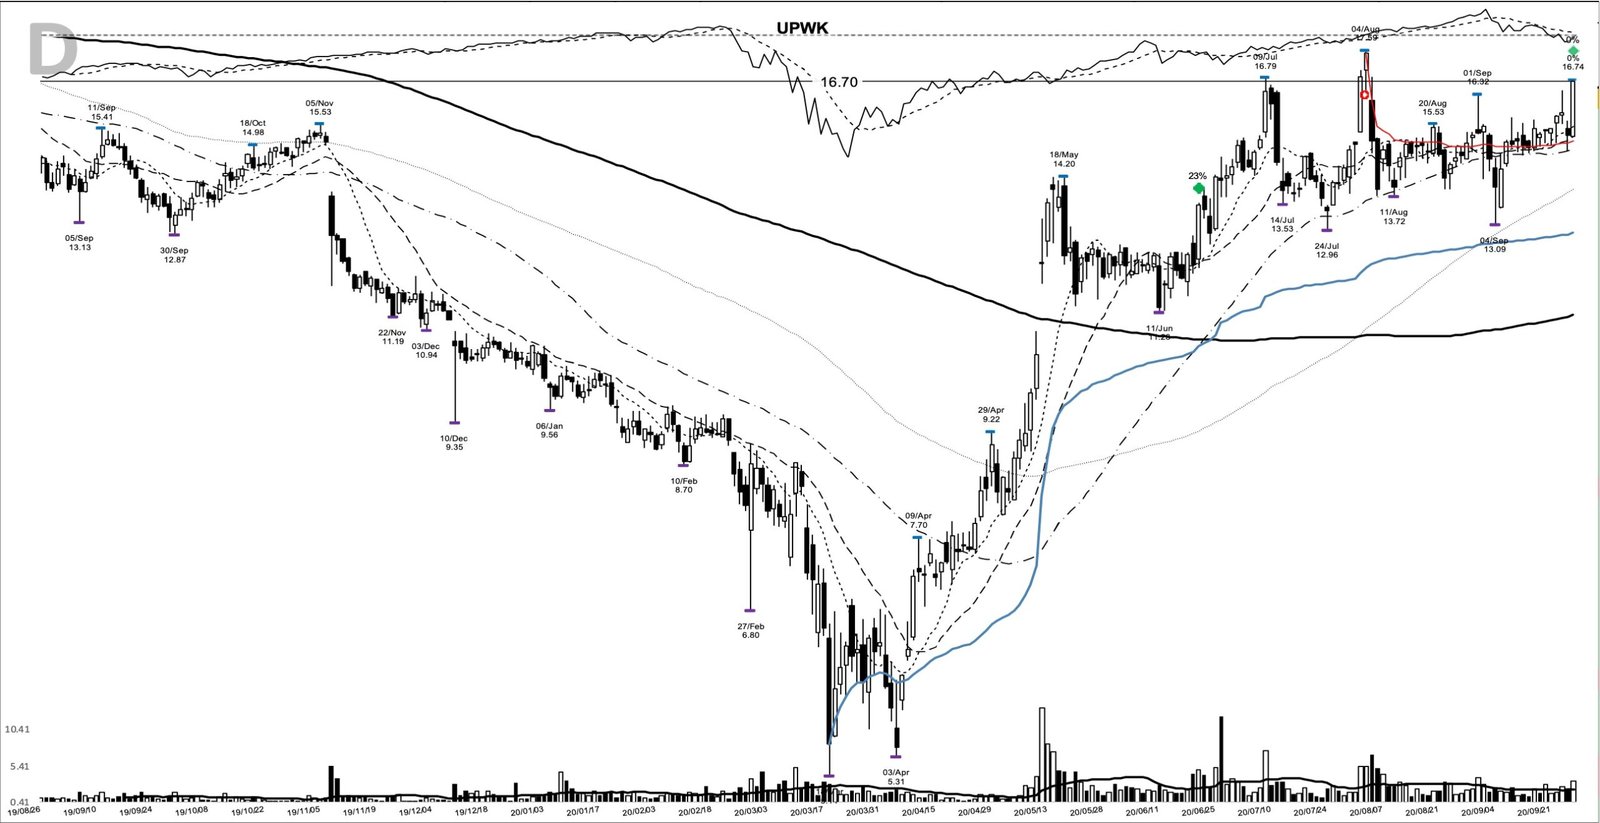
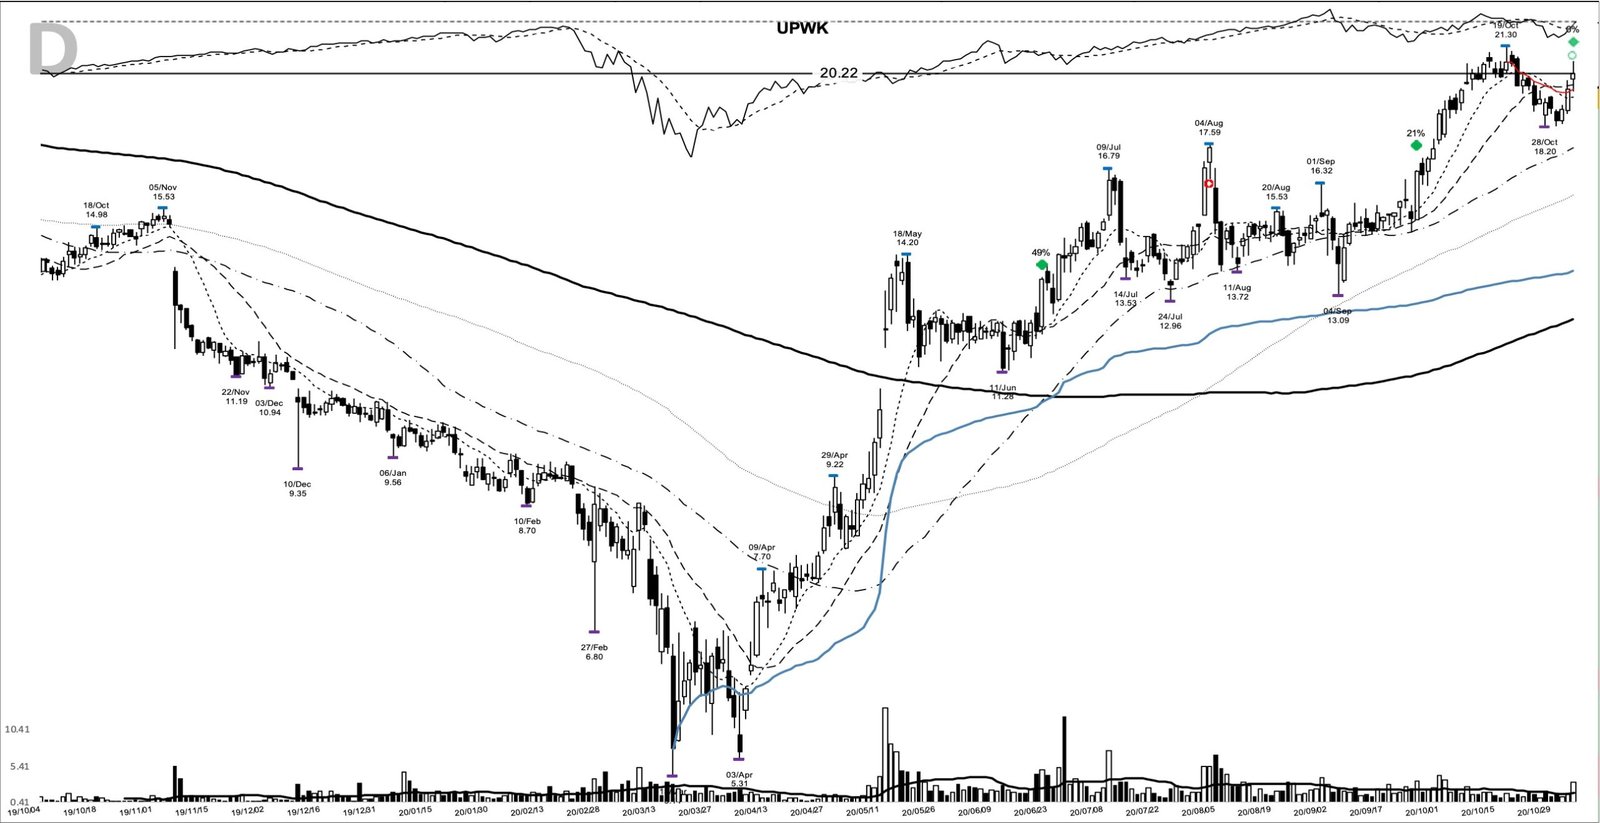
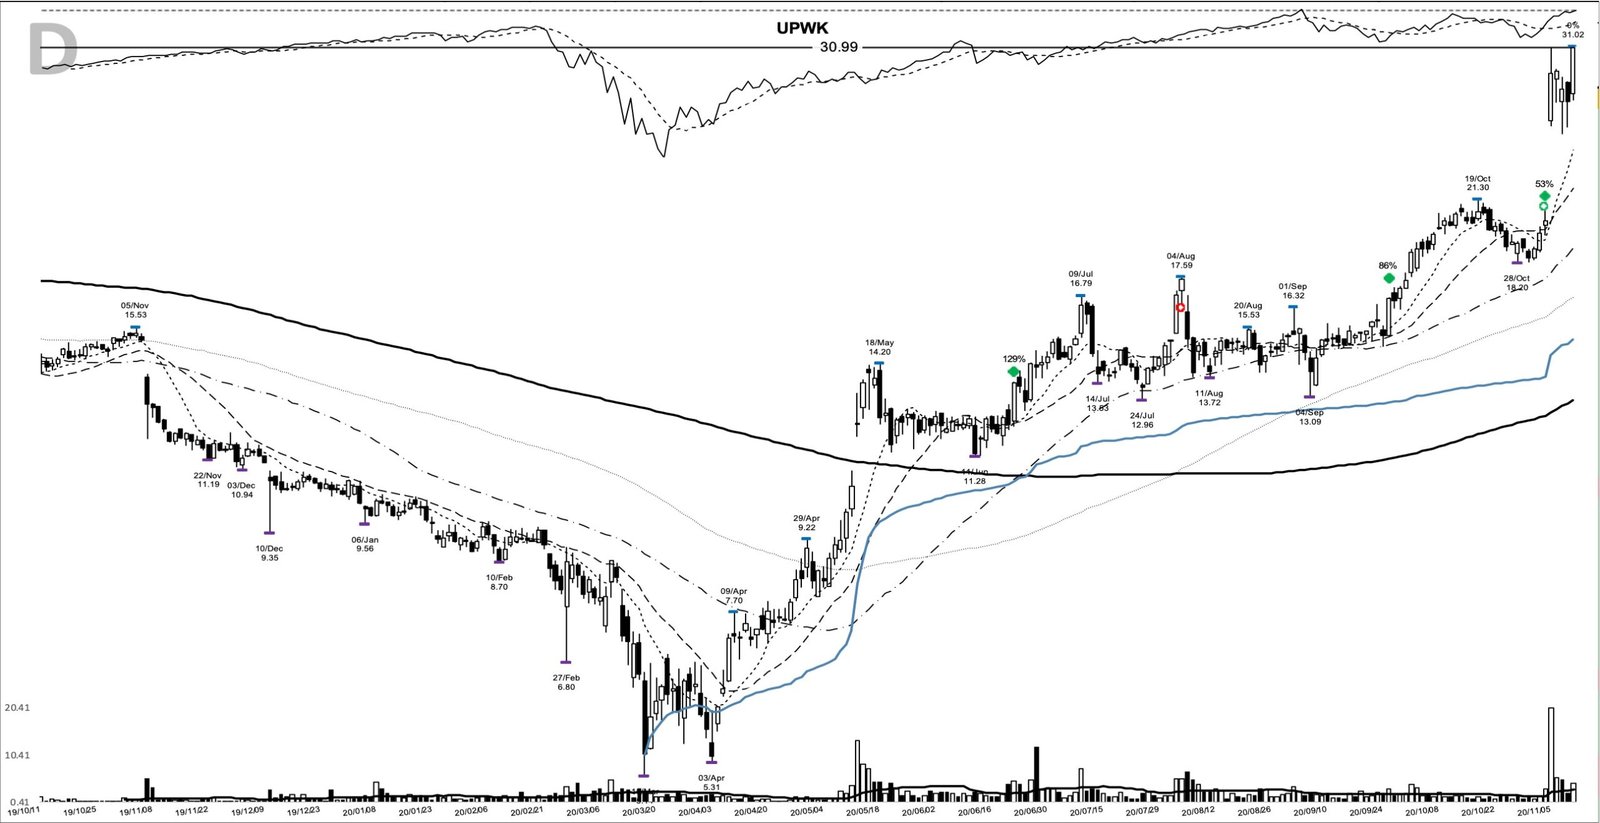
The continuation offered repeated higher-low entries. There were opportunities to add near the 16.70 close on 25 September, the 20.22 close on 4 November, and the 30.99 close on 11 November, each one a fresh push from a shallow rest. Scaling into strength this way, a pyramiding approach, is how a leader is pressed while the risk stays defined by the last low.
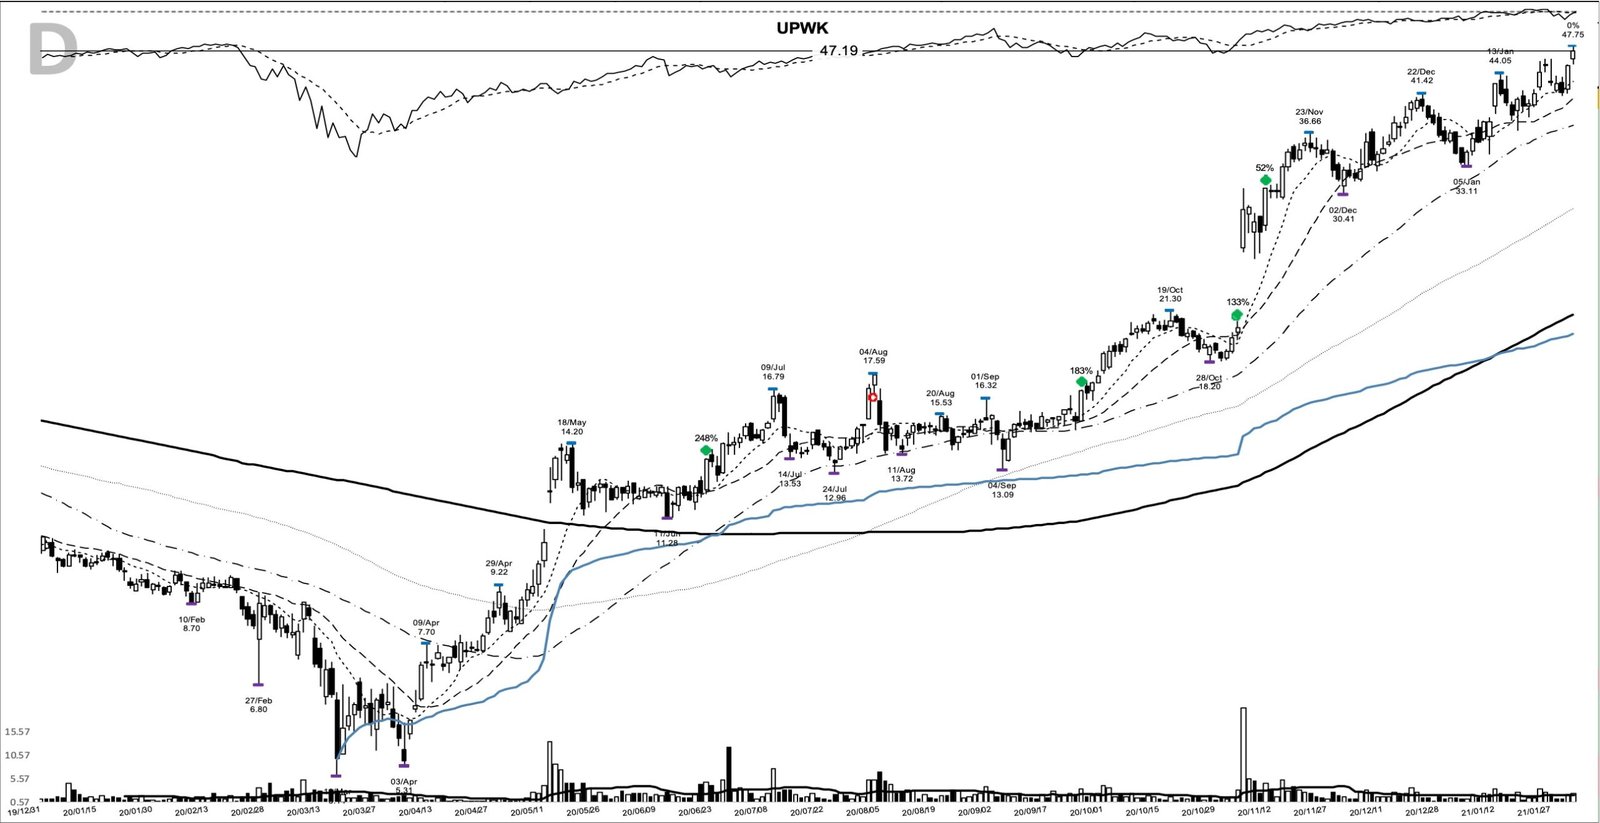
The inflection was the third-quarter report. Upwork closed at 20.22 on 4 November, then gapped to a 25.87 open and a 29.03 close on 5 November on more than 20 million shares, as the remote-work numbers came in strong. From there it kept trending, tagging a 47.19 close on 2 February 2021 and a 63.88 peak on 24 February. The marked exit at 43.58 closed the move 221.6% above the breakout close, 255 calendar days after entry. On the illustration a trader tends to remember, 1,000 dollars committed at the breakout would’ve become about 3,216 dollars by that exit.
The tape in the first days of March backed the exit. The market had slipped to an uptrend under pressure, with the growth-heavy index breaking support and collecting distribution while steadier corners of the market held, and the defensive default was smaller positions and little new buying. A work-from-home leader a third off its peak was exactly what that posture said to let go.
Common misreads on the UPWK breakout
The first misread’s expecting a straight line. The July round trip from a 16.41 close back to a 13.40 close would’ve looked like a failed breakout to anyone without a plan, when it was a normal shakeout that reset the trend. A breakout doesn’t promise the pullback will be shallow.
The second’s chasing the gap. Buying the 5 November open at 25.87, roughly 28% above the prior 20.22 close, meant paying up for an extended move that then chopped and closed at 27.14 on 10 November before pushing higher. The clean entries were the quiet continuations, not the exciting gap.
The last misread’s treating the 63.88 peak as an exit anyone could’ve caught. Price reached it in late February and was back to a 43.58 close within days. The 371% peak gain was a number on the chart, and the trend a follower actually kept was the 221.6% one measured to the exit.
What UPWK teaches about riding a leader
The UPWK base breakout rewards the boring parts of the craft: wait for a real close above a defined pivot, confirm it with volume, then hold and add while the trend and the fundamentals point the same way. The forecasting instinct that tries to buy the low and sell the exact top is what usually costs the eight-month move. Learn the pattern. Ride the trend. Keep the gains.
Related studies. For the same base-breakout pattern in a fellow work-from-home name, see the Wayfair base breakout of April 2020. For a larger-scale version of the same idea, the TSLA base breakout of November 2019 and the FSLY base breakout of May 2020 both trace the same anatomy. A new winner study lands here most evenings.
Price and volume figures are computed from split-adjusted daily OHLCV data; company figures come from SEC filings where cited.
Educational content only. Not investment advice. Trading involves risk. You are responsible for your decisions.
Get the free Market Wisdom e-book
Join Trends and Breakouts — historical winners, breakout studies, and risk lessons. No spam, unsubscribe anytime.