
A stock that topped at 60.00 has spent four weeks falling to 42.00, then bounced to 47.80 and gone quiet. Three weeks of trading sit in a narrow strip just under that 47.80 high. The left side of the base is still 12.20 points overhead, and the chart is nowhere near a classic breakout. Some traders would watch 47.80 anyway, because a move through it is the earliest point where the base starts to show repair. That early reference is what this guide calls a low-cheat setup, and the useful skill is knowing exactly where it sits and how much of the pattern it leaves unresolved.
Where the low-cheat setup sits inside a base
The word “cheat” comes from the growth-stock tradition of buying a base before its conventional pivot. A standard breakout reference sits near the top of a completed base, close to the left-side high. A cheat reference sits lower, at a small internal pause on the right side, while the base is still under construction. “Low” places that pause in the lower part of the base.
Authors draw these zones differently, so this article states its own convention and holds to it. Here, a low-cheat setup is a small, narrowing pause that forms after an initial rebound off the base low, with its top in roughly the lower third of the base’s depth. In the example, the base runs from 42.00 to 60.00, a 30.00% decline. The lower third ends at 48.00. The pause tops out at 47.80, which is 32.2% of the way from the low to the high.
That convention defines a location. It carries no rule about how many weeks the pause must last or how many percent it must contract, and you should be suspicious of any source that presents a single number for either as universal. If you compare early-entry styles across books or screeners, write each definition down first. “Cheat,” “low cheat,” “early entry” and “pullback buy” get used loosely, and two people using the same label may be marking different bars.
The sequence to recognise on the chart
The setup only makes sense as the fifth step of a six-step story. Each step is visible on a weekly chart, and skipping one changes what the pause means.
- The preceding advance. In the hypothetical, weekly closes rise from 50.20 to 59.40, with a high of 60.00. A low-cheat setup belongs to a stock that has already shown it can trend, which is why it’s usually read alongside the trend template’s moving-average and 52-week-high conditions.
- The correction. Closes fall through 55.80, 51.30 and 47.20 to 43.10, with a low of 42.00. That 60.00 high becomes the base’s conventional breakout level.
- The initial rebound. Two weeks lift the close to 45.60 and then 47.30, with a high at 47.80. That’s a 13.81% rally off the low.
- The narrowing pause. Weekly ranges shrink from 2.30 points (47.50 to 45.20) to 1.50 (47.40 to 45.90) to 0.80 (47.20 to 46.40).
- The internal resistance level. The 47.80 rebound high caps the pause. This is the low-cheat pivot.
- The resolution. Price either clears 47.80 and keeps building the right side, or it fails and returns toward the lows.
The contracting ranges echo the logic of the volatility contraction pattern, where each pullback is shallower than the last. In a low-cheat setup that contraction is a supporting observation. The defining feature is location: a pause near the bottom of an unfinished base, after a rebound has already started.
What the pause can and can’t tell you
A tightening pause shows that the range of accepted prices has narrowed. Each week’s low sits higher than the last, at 45.20, 45.90 and then 46.40, while the highs hold between 47.20 and 47.50. Price is being accepted in a smaller band. That’s an interpretation of price behaviour. Nothing on the chart identifies who is trading or why, and stories about institutions “quietly accumulating” in the pause are guesses attached to bars.
The second thing the pause provides is a nearby reference for being wrong. The 46.40 low of the tightest week is 1.40 points under the pivot. If price falls back through it, the improving behaviour that justified attention has reversed, and a trader using this pattern might treat that as invalidation.
A small pause on its own establishes very little. Tight weeks appear in downtrends, in dead stocks and halfway down a decline. Without the preceding advance, the base structure and a rebound off the low, three quiet weeks are just three quiet weeks. The common misread is to spot a tight range anywhere on the chart and call it a cheat.
Hypothetical risk arithmetic at two reference prices
The appeal of the early pivot shows up in a simple comparison. These numbers are hypothetical and illustrate structure only.
- Low-cheat reference: a trigger at 47.90, just above 47.80, with invalidation at 46.30, just under the 46.40 pause low. The distance is 1.60 points, or 3.34% of the trigger price.
- Conventional breakout reference: a trigger at 60.10 with invalidation at 57.10, under a late-stage handle low of 57.20. The distance is 3.00 points, or 4.99%.
So the earlier price sits closer to its local support in percentage terms. That’s the whole attraction, and it comes with a cost that the percentage hides. From 47.90 the stock still needs a 25.26% rise to reach the 60.00 breakout level. Every point between 47.80 and 60.00 is ground where holders who bought during the decline may be waiting to get out near their cost, which is the problem the overhead supply article describes. The breakout reference has a wider stop but no unfinished base above it.
Put differently, the low-cheat setup trades a tighter invalidation level for far more uncertainty about the larger pattern. A 3.34% distance tells you how close the nearest reference is. It says nothing about whether the base will complete.
Sequence A: the pivot leads to further base repair
Reveal the next ten weeks one at a time. In week 14, price trades to 48.90 and closes at 48.60, above the 47.80 pivot. Weeks 15 through 17 close at 50.40, 52.70 and 53.40, with a high of 53.90.
Then the stock pulls back. Week 18 closes at 51.60 with a low of 50.90, which holds above the old pivot. A trader would watch whether 47.80 now behaves as support, and here it isn’t tested at all. Weeks 19 through 22 close at 52.20, 54.80, 57.30 and 58.10, with a high at 58.60. Week 23 eases to 57.60 with a low of 57.20.
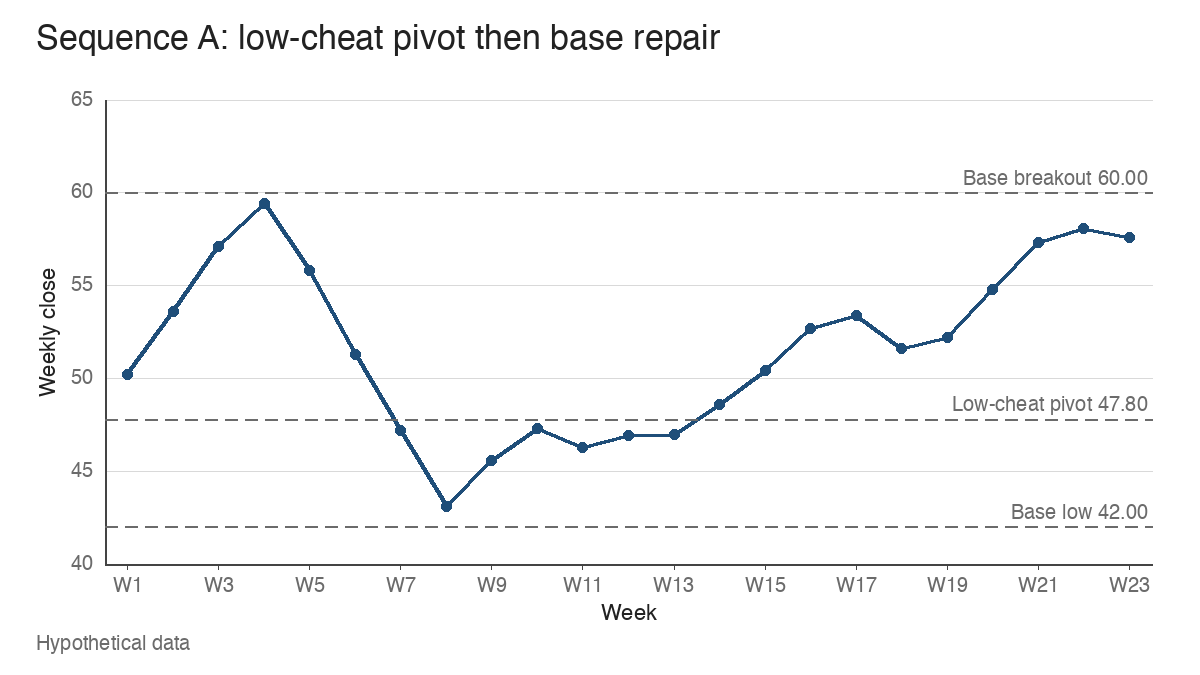
By week 23 the right side is nearly built, and a small handle is forming just under the left-side high. Notice what hasn’t happened. The 60.00 level hasn’t been cleared, and the close at 57.60 still sits 4.17% beneath it. The low-cheat pivot preceded genuine repair, yet the larger pattern remains a base. One reading of this chart is that the early pivot gave an earlier reference inside a base that later developed normally. That’s a description of one hypothetical path, and it says nothing about how often the path occurs.
Sequence B: the rebound fails
Start again from week 13, same pause, same 47.80 pivot. In week 14, price trades to 48.30 but closes at 46.80, back inside the pause. The week’s low is 46.60, so the 46.40 reference survives, barely.
Week 15 is where support breaks. One session closes just above the pause low. The next session’s high is 45.10, so the stock never trades between 46.40 and 45.10. It gaps straight through the invalidation level and closes the week at 44.20, with a low of 43.90. Weeks 16 and 17 close at 42.90 and 41.60, the second of those 0.95% below the 42.00 base low.
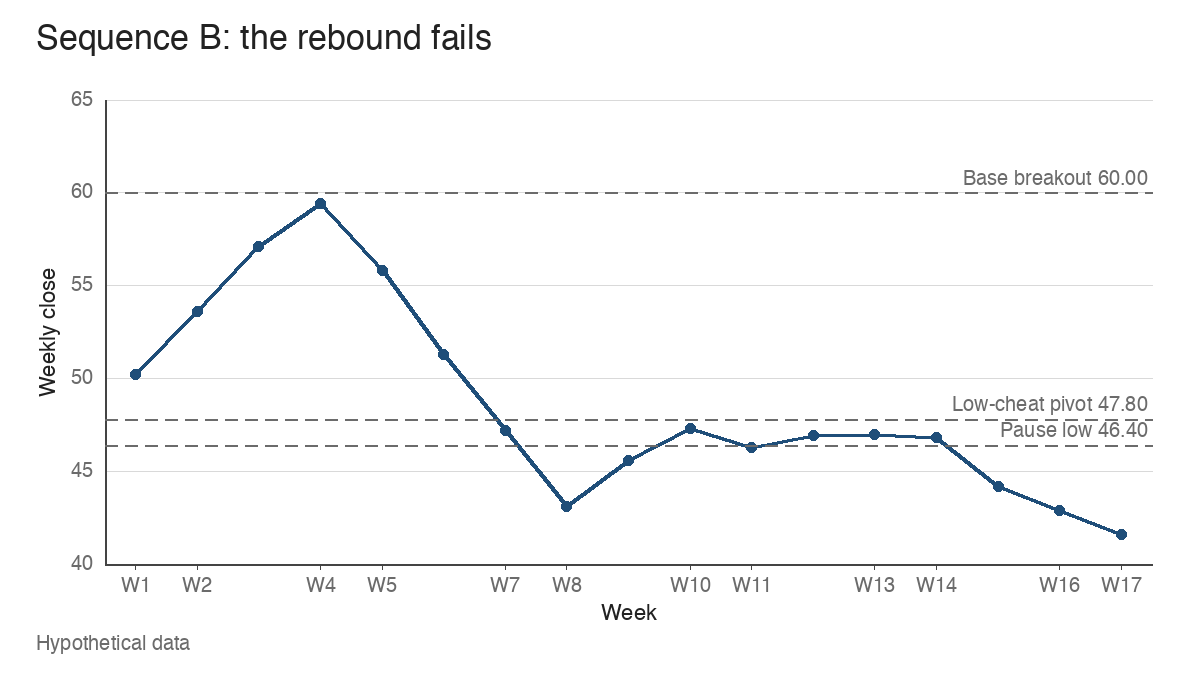
Run the arithmetic on the gap. With a 500 risk budget and a 1.60-point stop distance, the hypothetical position is 312 shares, sized for a 499.20 loss. Assume the first fill after the gap comes at 45.00. The loss is 2.90 points per share, or 6.05% of the 47.90 trigger, which works out to 1.81 times the planned risk and 904.80 in total. A tight stop limits planned risk. It can’t promise the market will trade at that price.
This is also the false-start problem in miniature. The push to 48.30 looked like resolution for part of a week, and the failed-breakout article covers how quickly that kind of move can reverse. An early pivot is exposed to this because it asks a damaged chart to recover from a low position, with most of the base still above it.
Where the low-cheat convention breaks down
Four limits apply to every chart you’ll mark this way.
Pattern boundaries are subjective. Whether the base low is 42.00 or an intraday spike below it, and whether the left-side high is 60.00 or a closing high at 59.40, changes the lower-third line. Two careful readers can disagree about whether a pause qualifies.
Overhead resistance stays unresolved. Even after a clean move through the internal pivot, the full depth of the remaining base sits above. Sequence A needed nine more weeks just to approach 60.00.
False starts repeat. A stock can clear an internal high, fail, form another pause a little higher, and fail again. Each attempt is a separate decision with its own invalidation level, and a string of them adds up.
Gaps ignore support. Sequence B shows a 1.60-point planned risk becoming 2.90 points in a single session. Thinly traded stocks and earnings dates make that more likely.
William O’Neil built his base-and-pivot method around the completed pattern, and the low-cheat convention is best understood as a deliberate step away from that discipline, earlier and with less confirmation.
Reading the early pivot for what it is
The low-cheat setup marks a location: a narrowing pause in the lower third of an unfinished base, after a rebound has begun, capped by a clear internal high. Read it as the first piece of evidence that repair may be under way, with a close invalidation point and a long stretch of unfinished structure above. Keep the base’s conventional breakout level marked on the same chart, so the distance between the two stays in view.
Learn the pattern. Ride the trend. Keep the gains.
Educational content only. Not investment advice. Trading involves risk. You are responsible for your decisions.
Get the free Market Wisdom e-book
Join Trends and Breakouts — historical winners, breakout studies, and risk lessons. No spam, unsubscribe anytime.