
A hypothetical stock climbs from a 40.00 weekly open to a 60.00 high in seven weeks, falls to 48.00, rebounds to 55.00, drops again to 47.00 and is now trading at 54.40. Drawn after the fact, that path looks like a clean W, and a finished W invites a finished conclusion. The useful way to study a double-bottom base is the opposite one: read it week by week, in the order the bars arrived, and decide what each stage does and does not show before the next one is revealed.
Every price and volume figure below is hypothetical, built so the arithmetic can be checked. No real security is involved, and no level here is a suggested entry or exit for anyone.
The four parts of a double-bottom base
A double-bottom base is a consolidation that forms after a prior advance. It has two troughs separated by an intervening rally, and it ends with a recovery on the right side. Four reference points describe it:
- The first low: the bottom of the first decline from the base’s starting high.
- The middle peak: the high of the rally between the two troughs.
- The second low: the bottom of the second decline, which by common convention trades slightly below the first low.
- The right-side recovery: the advance from the second low back toward the middle peak.
The geometry is the easy part. The harder part is that none of these points is confirmed when it prints. A low becomes “the first low” only after price rallies away from it, and a rally high becomes “the middle peak” only after price turns down again. The labels are retrospective, and a reader who applies them in real time is borrowing knowledge from bars that don’t exist yet.
Stage one: an advance, then the first decline
Here’s the sequence as it would have arrived. Weeks 1 to 6 carry the stock from a 40.00 open to a 58.40 close. Week 7 reaches 60.00 intraday and closes at 57.60, well off the high. That 50.00% advance from the week-1 open to the week-7 high is the prior trend, and it’s the first thing a double-bottom base requires. Without an advance to consolidate, two lows are only two lows.
Weeks 8 to 11 decline. The low of week 11 is 48.00, a 20.00% drop from 60.00. Volume across those four weeks averages 822.5 thousand shares, above anything the advance printed, and the average weekly range is 6.84% of the close.
At this point the chart shows a correction. It does not show a base, because nothing yet distinguishes a pause from the start of a larger decline. Week 11 closes at 50.10, 2.10 above its low, which is a modest detail and nothing more.
Stage two: the rally that sets the middle peak
Weeks 12 to 14 rebound. Week 14 reaches 55.00 and closes at 53.20. The rally recovers 58.33% of the first decline, and volume drops to an average of 576.7 thousand shares, lighter than the decline that preceded it.
Is 55.00 the middle peak? Not yet. If the stock kept rising through 55.00 and on to 60.00, there would be no second trough, and the structure would be a different base altogether, perhaps the left side of a cup-with-handle pattern. The middle peak exists only once price turns lower from it, which week 15 does.
Stage three: the second low and the undercut
Weeks 15 to 17 decline from 55.00. Week 17 trades to 47.00, 1.00 below the first low and an undercut of 2.08%, then closes at 48.90, back above 48.00 and in the top 13.6% of the week’s 2.20 range. The second decline averages 610.0 thousand shares, below the 822.5 thousand of the first.
The undercut is the convention most often associated with the pattern, and the observable part of it is simple: the second low is lower than the first. The usual explanation is that the move below 48.00 triggers stops and shakes out weaker holders, so that the remaining supply sits with steadier owners. That story may be true in a given case, but the chart can’t show it. A price that dips below a prior low and closes back above it is visible. Who sold, and why, is an inference.
Treat the undercut as a description of the shape rather than evidence of a change in ownership. A second low at 47.00 that keeps falling to 44.00 the following week has the same undercut and a very different meaning.
Stage four: the right side and the 55.00 pivot
Weeks 18 to 20 recover to a week-20 close of 54.40, 1.09% below 55.00. The weekly ranges narrow from 5.28% to 4.53% to 4.04% of the close, an average of 4.62% against 6.84% in the first decline. Volume averages 643.3 thousand shares.
The full base, from the 60.00 high in week 7 to week 20, now looks like this.
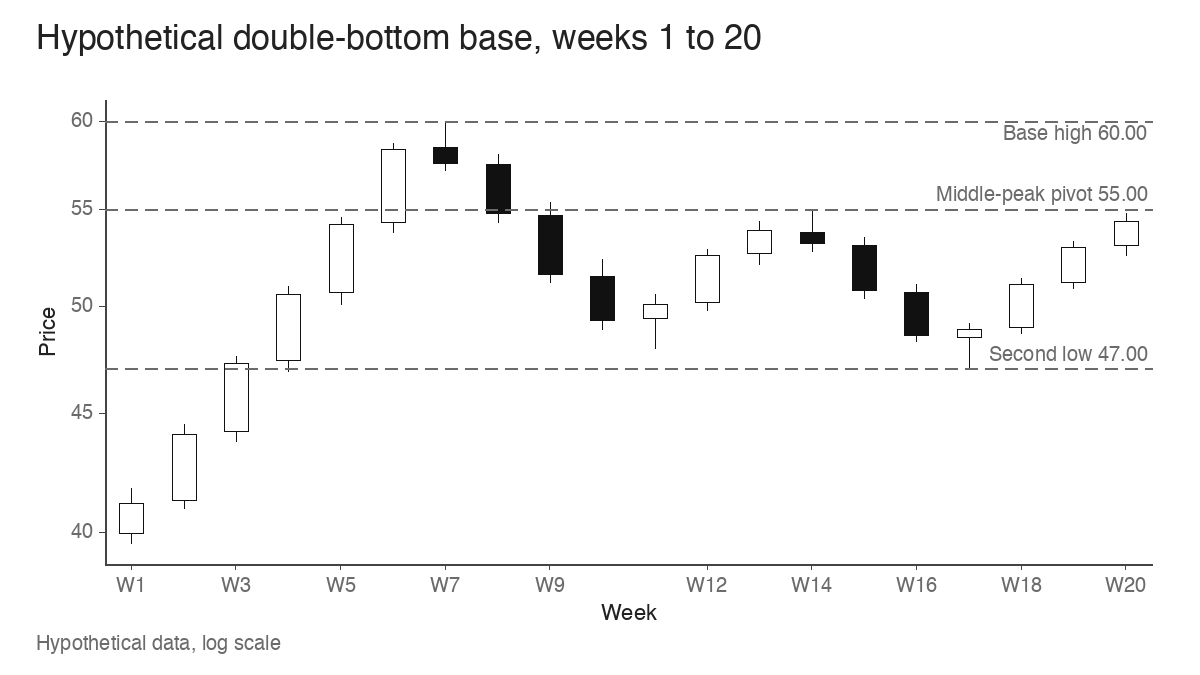
The conventional pivot reference for a double bottom is the high of the middle peak, here 55.00, and O’Neil’s descriptions of the pattern place it there rather than at the base’s starting high. The reasoning is structural. The 55.00 high is the last point where the rally between the two lows failed, so a sustained move through it shows that the stock has absorbed the selling that stopped the previous attempt. The 60.00 high still matters, as the top of the zone where week 7 to week 9 buyers may want to get out near breakeven. That zone is the overhead supply a breakout through 55.00 runs into.
Keep two ideas apart here. A pivot is a reference level on the chart. An execution convention is a rule about what has to happen at that level: an intraday trade above it, a weekly close above it, a close by some margin, a volume threshold, or a limit on how far above the pivot is still acceptable. Two traders can agree that 55.00 is the pivot and still disagree completely about whether a given week broke out. Week 14 itself touched 55.00 exactly and closed at 53.20. Touching the price established nothing.
The same base, three different week 21s
The base ends at week 20. What follows splits three ways, and the bars through week 20 are identical in all three. Volume is compared with the 619.0 thousand share average of weeks 11 to 20.
| Week | Path A | Path B | Path C |
|---|---|---|---|
| 21 | High 56.90, close 56.40, volume 1.86x | High 55.70, close 55.30, volume 0.90x | High 56.80, close 56.20, volume 1.74x |
| 22 | Close 57.40, volume 1.58x | Low 52.60, close 52.90, volume 1.16x | Low 54.10, close 54.40, volume 1.63x |
| 23 | Close 58.90, volume 1.45x | Close 50.60, volume 1.26x | Close 51.80, volume 1.81x |
Path A is the sustained move. Week 21 closes 1.40 above the pivot, 2.55% clear, in the top fifth of its range, on 1.86 times average volume. Weeks 22 and 23 keep closing higher, and week 23’s 58.90 close sits 1.83% under the old 60.00 high, which is where the overhead supply from weeks 7 to 9 begins to be tested. The breakout is holding through three completed weeks.
Path B is the brief crossing. Week 21 trades to 55.70 and closes at 55.30, only 0.30 above the pivot, on volume below the average. By most execution conventions that week is marginal at best. Week 22 falls back to 52.90 and week 23 closes at 50.60, 8.00% below the pivot. A trader who counted the 55.70 high as a breakout was counting a touch. The failed breakout guide covers how to read the week after a crossing like this one.
Path C is the one to study. Week 21 closes at 56.20 on 1.74 times average volume, nearly as convincing as path A on every number in the table. Week 22 closes at 54.40, back under the pivot, and week 23 closes at 51.80, 5.82% below 55.00 and 7.83% below the week-21 close, with volume at 1.63 times the average in week 22 and 1.81 times in week 23. Nothing in the base distinguished C from A. The outline, the undercut, the tightening and the breakout volume were all present, and the move still failed.
That’s the most important limit of the pattern. A sound-looking double bottom describes a stock that has repaired a correction; it doesn’t describe what the market, the group or the next earnings report will do in the following three weeks.
Checking the base before trusting the outline
An attractive W is one input. The characteristics below are where a reader can test the base, and the example’s numbers show what each check looks like in practice.
| Check | What to measure | What the example shows |
|---|---|---|
| Prior trend | Advance into the base’s starting high | 50.00% from 40.00 to 60.00 in seven weeks |
| Depth | Starting high to the lower of the two lows | 21.67%, from 60.00 to 47.00 |
| Duration | Weeks from the starting high to the right-side recovery | 14 weeks, week 7 to week 20 |
| Symmetry | Length of each leg | 4 weeks down, 3 up, 3 down, 3 up |
| Tightness | Average weekly range as a share of the close | 6.84% in the first decline, 4.62% in weeks 18 to 20 |
| Volume by leg | Average volume in declines versus recoveries | Declines 822.5 and 610.0 thousand, rebound 576.7, recovery 643.3 |
| Volume by week | Up-week versus down-week average inside the base | 7 up weeks at 625.7 thousand, 6 down weeks at 733.3 |
The last row is a fair warning sign in a base that otherwise looks orderly. Down weeks inside the base carried more volume on average than up weeks, mostly because of the heavy first decline. The second decline was lighter, and that improvement is real, but the base never showed sustained heavy buying on its rallies. In William O’Neil’s descriptions, a double bottom generally runs at least seven weeks; this one clears that comfortably, which says nothing about whether it will work.
Context outside the base matters as much as the base. Whether the relative strength line is near its highs against the market, whether this is a first base after the advance or a late-stage one by base counting, and what the general market is doing during weeks 18 to 21 are all separate questions the W can’t answer.
Two lows that aren’t a double-bottom base
The loose W. Take a second hypothetical stock with the same 60.00 starting high. Its first decline reaches 41.40, 31.00% deep. The middle rally gets to 56.20, recovering 79.57% of that decline, and the second low undercuts to 39.80, a total depth of 33.67%. Across 14 weeks the average weekly range is 12.64% of the close, and the last three weeks still average 11.66%. It has an obvious W outline and none of the tightening. Weekly swings that wide mean the right side hasn’t settled, and a crossing of 56.20 on that kind of chart says little about whether supply has been absorbed.
The downtrend with two lows. Now take a third stock that fell from 80.00 to 50.00 over half a year, then printed lows of 48.00 and 47.00 with a 55.00 rally between them. The W is identical to the main example, level for level. The context is the reverse. There’s no prior advance to consolidate; the stock is 41.25% below its high at the second low, and the middle peak sits 31.25% under 80.00, with months of trapped buyers above it. A move through 55.00 here is a rally inside a decline. The same reading of the shape gives the wrong answer because the base requirement, a consolidation after an advance, was never met.
Path C, from the previous section, is the third contrast: a base that passed the checks and still failed. Together the three examples cover the common errors, which are trusting a loose shape, ignoring the trend the shape sits in, and treating a well-formed shape as a result.
Why the pattern boundaries stay subjective
Several choices in this article were judgements. The base was dated from week 7 because that’s where the 60.00 high printed; a reader who started it at week 8 would get a 13-week base. Whether a 1.00 undercut qualifies, or a 0.10 one would, or a second low exactly at 48.00, is a matter of convention. The same goes for whether week 20’s 54.40 counts as the end of the right side or week 19 does. Flat bases and cup-with-handle shapes share the same problem, and studies of finished winners make it worse, because the eye finds the cleanest W in a chart already known to have worked.
Reading the chart chronologically is the practical defence. Mark each low and peak only after the bars that confirm it, write down the pivot and the execution convention before week 21, and compare the actual week-21 close and volume against them. Paths A, B and C were indistinguishable through week 20. The difference was entirely in what happened at and after the pivot.
Reading the W as it forms
The middle peak gives the double-bottom base its usable reference, and 55.00 was the level every path had to deal with. What the base cannot supply is the outcome. Path A held above the pivot, path B barely crossed it, and path C looked like A for a week before failing. A trader studying the pattern might judge the base on its trend, depth, tightness and volume, then let the completed weeks after the pivot decide which of the three paths is underway.
Learn the pattern. Ride the trend. Keep the gains.
Educational content only. Not investment advice. Trading involves risk. You are responsible for your decisions.
Get the free Market Wisdom e-book
Join Trends and Breakouts — historical winners, breakout studies, and risk lessons. No spam, unsubscribe anytime.