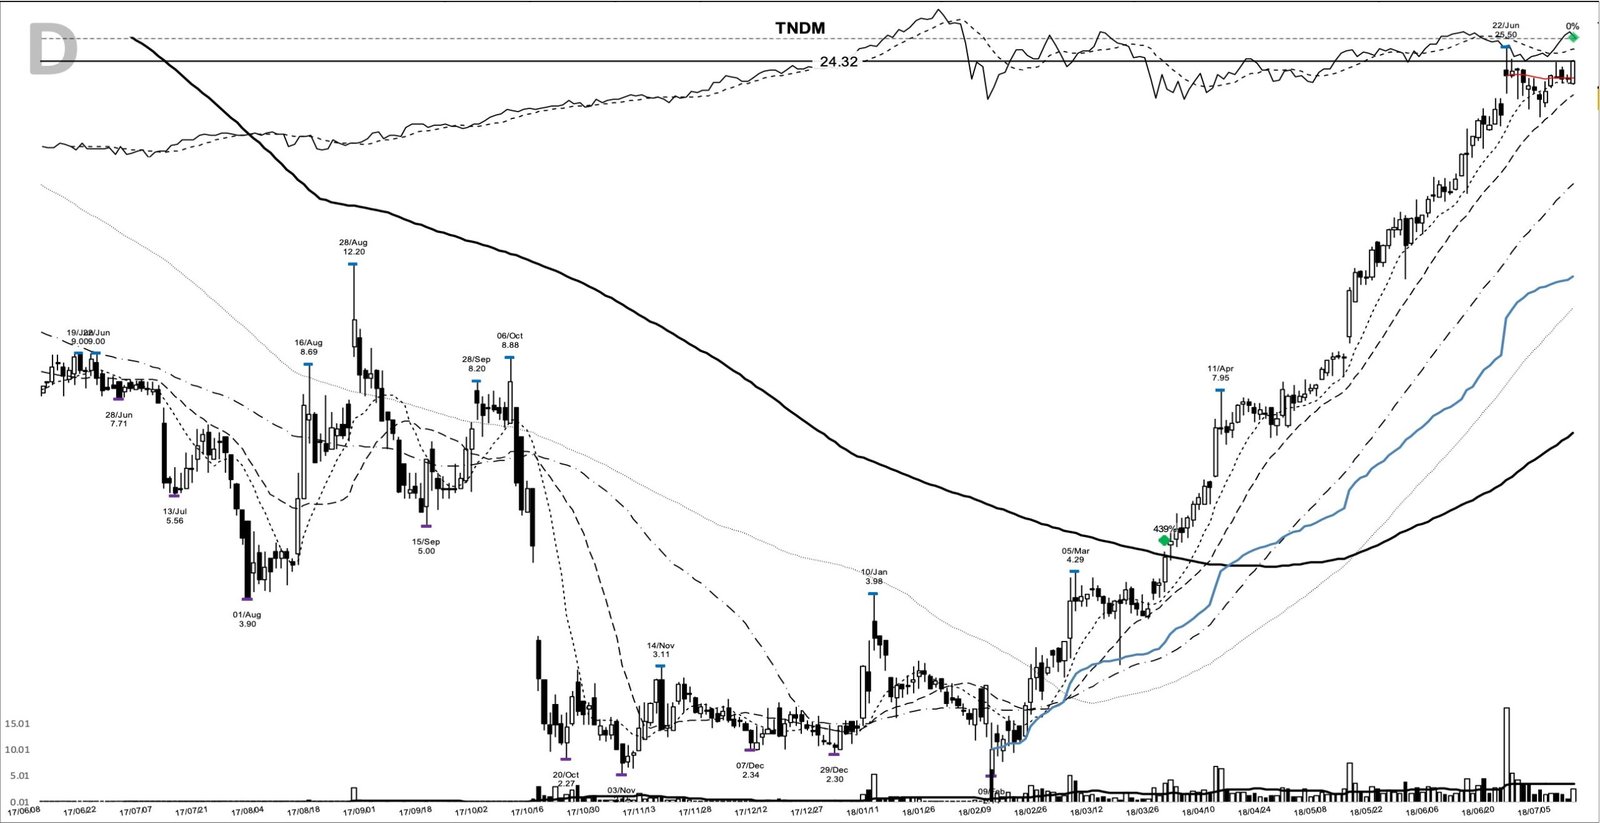
After the close on 8 February 2018, Tandem Diabetes Care priced new stock at two dollars a share. The next day its shares traded down to 2.14 on 6,296,464 shares. Seven weeks later, on 27 March, the stock closed at 4.51 and cleared the 4.29 pivot it had set on 5 March. When TNDM shows up on traders’ screens again, this is the chart worth studying. In short: a late March 2018 TNDM base breakout that moved 790.9% from the entry close to the exit close in 174 calendar days.
Key takeaways from the TNDM base breakout
- The pattern: a 75.9%-deep base from an 8.88 high on 6 October 2017 to a 2.14 low on 9 February 2018, with a 4.29 pivot from 5 March.
- The entry day cleared that pivot on a 4.51 close, with volume at 2.4 times the 20-day average.
- The move: 790.9% from the 4.51 close to a 40.18 exit close in 174 calendar days, after a 52.55 peak on 13 September.
- Two add-on points followed, on 11 July at 24.32 and on 14 August at 33.51.
- The lesson: a 10-day trail ended the trade in April; the 20-day line held all but one close until September.
| Field | Value |
|---|---|
| Ticker | TNDM |
| Breakout date | 2018-03-27 |
| Breakout close | 4.51 |
| Volume vs 20-day average | 2.4x |
| Exit date | 2018-09-17 |
| Exit close | 40.18 |
| Price change, entry close to exit close | 790.9% |
| Calendar days | 174 |
| Peak before exit | 52.55 (2018-09-13) |
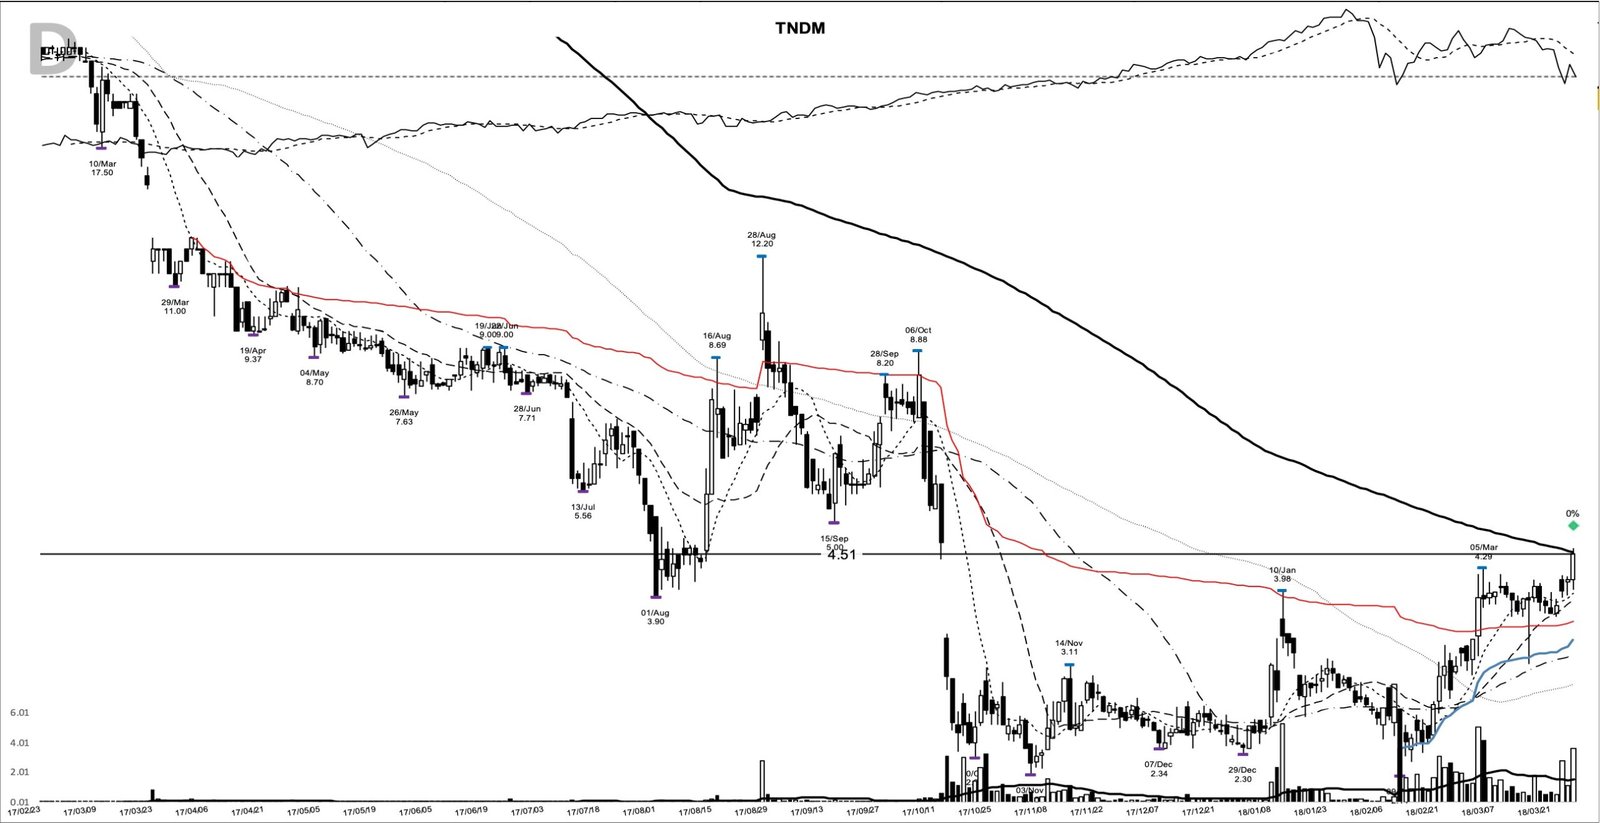
Inside the 75.9% base: from 8.88 down to 2.14, then up to the 4.29 pivot
The charts here come from my study archive, and the entry chart starts with a company in trouble. TNDM spent most of 2017 falling, and the last real rally topped at 8.88 on 6 October. A week later it was a different stock. Between 9 October and 13 October price dropped from a 5.811 close to a 2.99 close, the 13 October session on 3,096,449 shares.
Four months of drifting near the lows followed. Price spiked to 3.98 on 10 January on 5,239,879 shares, then gave the move back. On 9 February it opened at 2.15, touched 2.14 and closed at 2.35 on 6,296,464 shares, about 13.5 times the 20-day average. That was the base low, and it came the session after a share sale priced well below the prior close.
From there the right side built quickly. Closes of 2.72 on 20 February and 2.99 on 21 February came on volume above 1.6 million shares, and on 2 March the stock closed at 3.89 on 5,006,819 shares. The 4.29 intraday high on 5 March set the pivot. For the next three weeks closes held between 3.70 and 4.13, a tight shelf for a stock this volatile. The one scare came on 15 March, when price dropped to 3.12 intraday and still closed at 3.86.
The breakout bar on 27 March opened at 4.14, ran to 4.59 and closed at 4.51, 5.1% above the pivot. Volume was 3,571,417 shares, 2.4 times the 20-day average. The close cleared the pivot on the day, so this was a confirmed breakout. The next session added a 4.76 close on 4,193,329 shares.
Tandem Diabetes in early 2018: an insulin pump maker that nearly ran out of cash
Tandem makes the t:slim X2 insulin pump. In October 2017 the company warned in an SEC filing that there was substantial doubt about its ability to continue as a going concern, effected a 1-for-10 reverse split to protect its Nasdaq listing, and sold shares with warrants attached. All prices in this study are split-adjusted, which is why the early 2017 bars sit above 20.
The business was moving the other way. SEC revenue figures show 18,977,000 dollars in the first quarter of 2017, 21,327,000 in the second, 27,003,000 in the third and 40,294,000 in the fourth. That fourth quarter ran 49.2% above the third and more than doubled the first. The SEC data used here carries quarterly revenue only, so this study cites no earnings figures.
Coverage at the time tied the growth to the X2’s Dexcom G5 glucose monitor integration and its remote software updates. The February financing removed the cash question. The base low and the fix for the balance sheet landed within a day of each other.
The run that followed kept getting fresh news. Preliminary first-quarter results on 10 April sent the stock to a 7.01 close on 6,695,000 shares. On 21 June the FDA approved the t:slim X2 with Basal-IQ, a feature that suspends insulin when a low is predicted, and the next session closed at 23.15 on 17,879,055 shares, after a 25.50 high. By 11 July price had settled into a tight range under that high, and the 24.32 close that day was the first add-on point.
A trade-war selloff in the week before 27 March
The broad tape was no help. On 22 March 2018 new tariffs on Chinese goods sent the S&P 500 to its biggest drop since early February, while the Facebook data scandal dragged technology shares lower. Reports called it the worst week for US stocks in two years. TNDM closed at 3.79 on 22 March and was back at 3.99 the next day. A stock that ignores a weak tape like that is showing its own demand, and it’s the kind of strength the relative strength line is built to catch.
Preparing for the 4.29 pivot: the shelf, the 200-day line and the plan
The trend posture on 27 March was young but clean. Price had closed above its 10-day moving average for 3 straight sessions. The 10-day sat at 3.95, the 20-day at 3.87 and the 50-day at 3.22, all stacked in order, and the close was 14.2% above the 10-day. The one line still overhead was the falling 200-day average at about 4.54, which the 4.51 close sat just under. On the chart the breakout bar is pushing straight into it.
What would have put TNDM on a watchlist was the February volume. After the offering, the stock traded above a million shares on most sessions, where it had traded a few hundred thousand a day in early February. Then the March shelf tightened under 4.29 on lighter volume, with 480,080 shares on 22 March.
A trend follower could have written this plan before 27 March. Entry above the 4.29 pivot from 5 March. An initial stop below the 3.65 shelf low from 22 March, 14.9% under the pivot. The 2.14 base low from 9 February was where the structure failed, more than 50% away and far too wide for a stop. Then trail the 10-day moving average, widening to the 20-day once the stock was well advanced. From the 4.51 close, the same stop sat 19.1% away.
From 4.51 to 52.55: Basal-IQ, a second add and the 17 September exit
A trader using this pattern might have watched whether the 4.29 pivot held. It did, and price never closed back under it. The first close below the 10-day line came on 24 April at 7.09, 57.2% above the breakout close, and a strict 10-day trail would have ended the trade there. The 20-day line held until 30 July, the day Tandem reported second-quarter results, when price closed at 24.84 against a 20-day average near 25.21. The next session closed at 27.56.
That one close is the weak point of the trail: a rule followed to the letter would have exited 450.8% above the entry. On 2 and 3 August price jumped to 31.39 and 33.03, the second day on 7,442,148 shares, as the raised sales outlook from the results sank in.
The second add-on point came on 14 August. After a pullback to a 30.30 close on 8 August, price closed at 33.51, close to the 33.93 high from 6 August, with 643.0% already in the move.
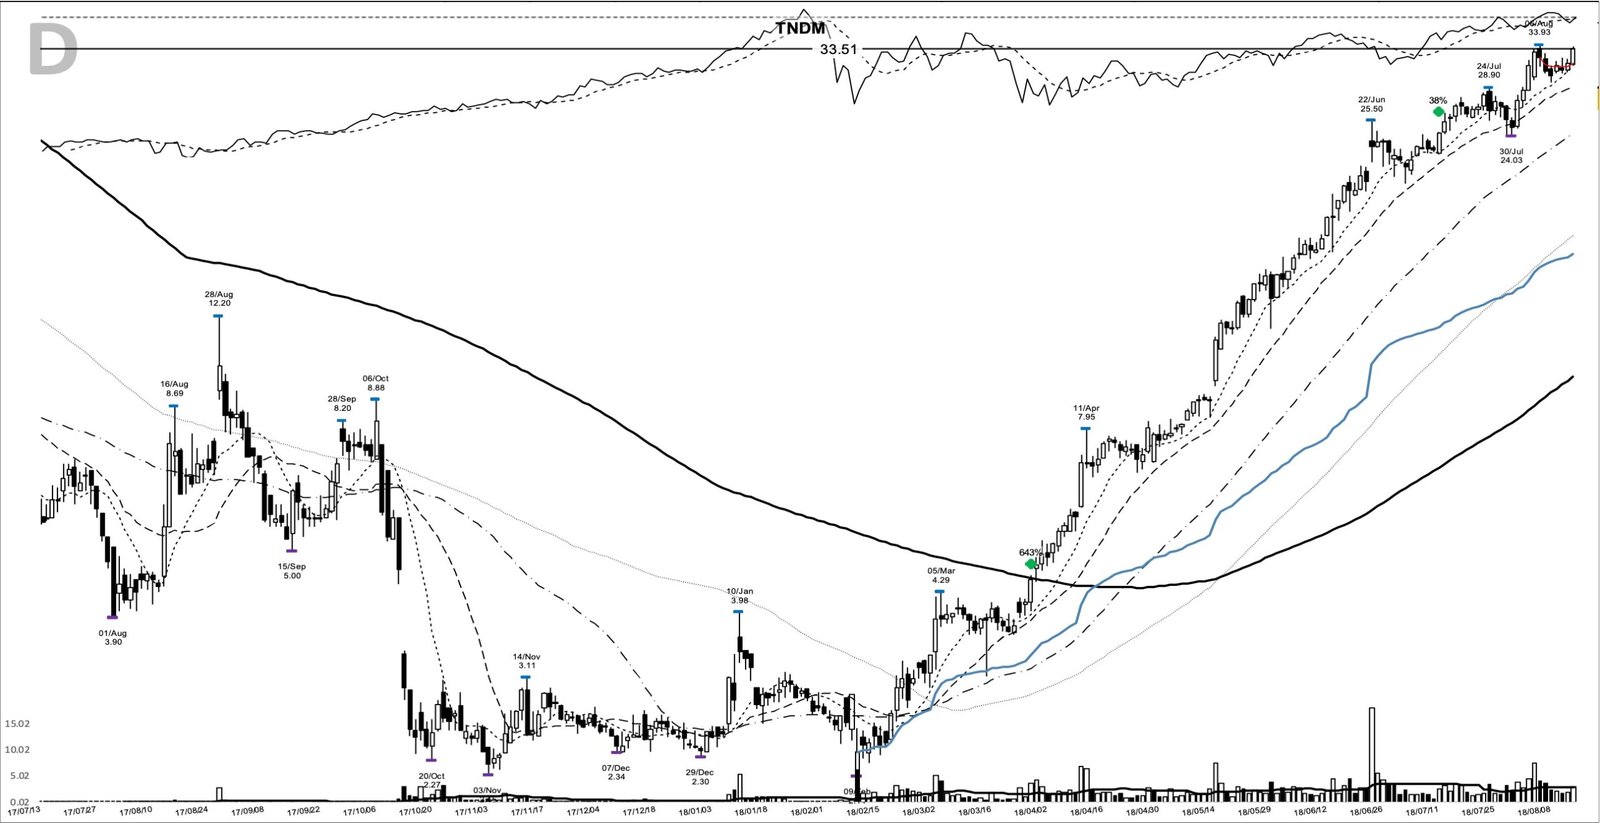
The last leg was steep. Price closed at 44.05 on 30 August, 48.62 on 12 September, and on 13 September reached the 52.55 peak before closing at 51.17. Two sessions later the trend broke. On 17 September price fell to a 38.50 low and closed at 40.18 on 10,177,963 shares, below both the 10-day and the 20-day lines. There was no company news that day. That close was the exit, 23.5% below the peak, and a notional 1,000 dollars riding the full move from the entry close would have become about 8,900 dollars.
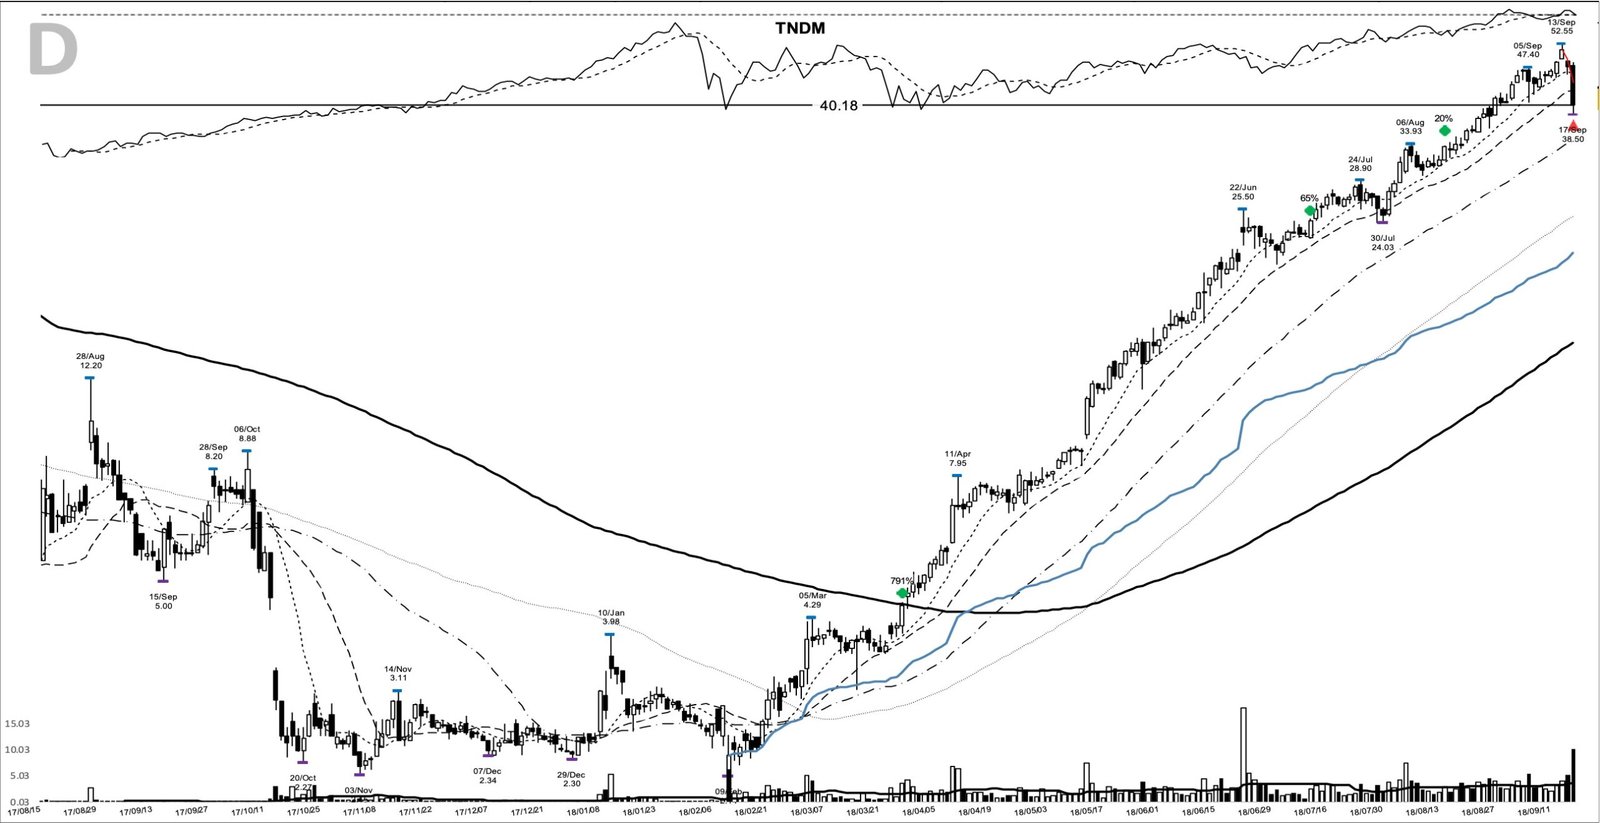
Adding on strength follows the logic of pyramiding into a position, and both adds here still had room. The July add had 65.2% left to the exit and the August add 19.9%.
Where the TNDM chart misleads
First, the breakout didn’t fix the long-term trend. The 4.51 close sat 65.3% below the 13.00 high from 3 April 2017 and still under a falling 200-day line. A base this deep often produces a short rally and a failed breakout rather than a new leader, and nothing on 27 March proved otherwise.
Second, the fundamentals were thinner than the price move suggests. William O’Neil’s model leaders paired breakouts with strong earnings. Tandem had fast-rising revenue and no earnings figures in the data, and the October going-concern warning was less than six months old.
Third, the stop was wide. A 19.1% distance from the breakout close to the 3.65 shelf is far beyond the 7-8% stop-loss rule, so a trader holding normal risk per trade would have carried a much smaller position than the chart’s gain implies.
What TNDM’s 2018 run teaches about trailing a winner
The choice of moving average decided this trade. The 10-day trail would have banked 57.2% in April. The 20-day trail stayed in until late July and, with one close of slack, to 17 September. Nobody knows the outcome in advance, but you can decide before the entry how much room a volatile stock gets.
Learn the pattern. Ride the trend. Keep the gains.
Related studies: AXSM base breakout 2019; MYGN base breakout September 1999; JMIA base breakout July 2020. A new winner study lands most evenings.
Price and volume figures are computed from split-adjusted daily OHLCV data; company figures come from SEC filings where cited.
Educational content only. Not investment advice. Trading involves risk. You are responsible for your decisions.
Get the free Market Wisdom e-book
Join Trends and Breakouts — historical winners, breakout studies, and risk lessons. No spam, unsubscribe anytime.