On 4 January 2021 Tilray closed at 90.00, 10.10 points under the 100.10 spike high its merger announcement had printed three weeks earlier. Two days later the Georgia runoffs handed cannabis stocks a new story, and five weeks after that the stock traded at 670.00. When TLRY shows up on traders’ screens again, as it does this week on Yahoo’s trending list, this is the chart worth studying. The tlry base breakout of early 2021 in one line: a January entry below the pivot of a six-month base, and a move worth 192.1 percent in 49 calendar days.
Key takeaways from the TLRY chart of January 2021
- The pattern: a deep six-month base, 63.7 percent from the 121.5 high on 9 November 2020 to the 44.1 low on 24 September, capped by a 100.1 pivot.
- The entry came before the pivot: a 90.00 close on 4 January, with the pivot cleared on 6 January at 107.7.
- The move: +192.1 percent to the 262.9 exit on 22 February 2021, 49 calendar days after the entry, with a 670.0 intraday peak on 10 February.
- A second chance came on 2 February, when the stock closed at 234.9 on its way into the squeeze.
- The lesson: a trend that goes vertical gives back fast, so the trailing rule decides how much of it stays on the table.
The TLRY trade at a glance
| Field | Value |
|---|---|
| Ticker | TLRY |
| Study entry date | 4 January 2021 (anticipatory) |
| Entry close | $90.00 |
| Pivot (20-day high) | $100.10 |
| Pivot cleared | 6 January 2021 at $107.70 |
| Volume vs 20-day average | 0.9x |
| Exit date | 22 February 2021 |
| Exit close | $262.90 |
| Gain | +192.1% |
| Calendar days | 49 |
| Peak before exit | $670.00 (10 February 2021) |
How the TLRY base breakout took shape under 100.1
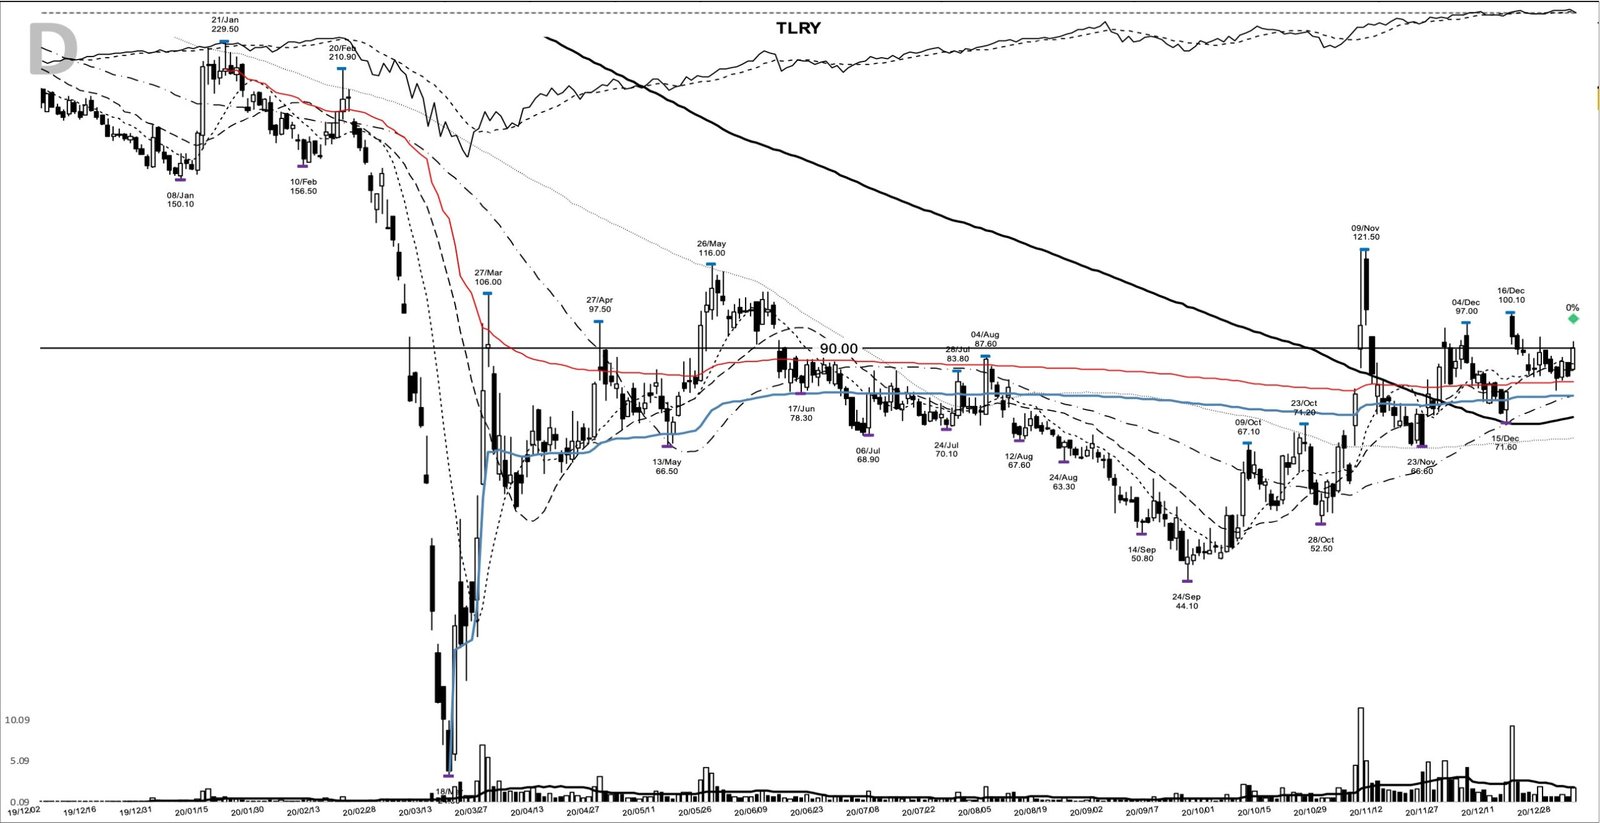
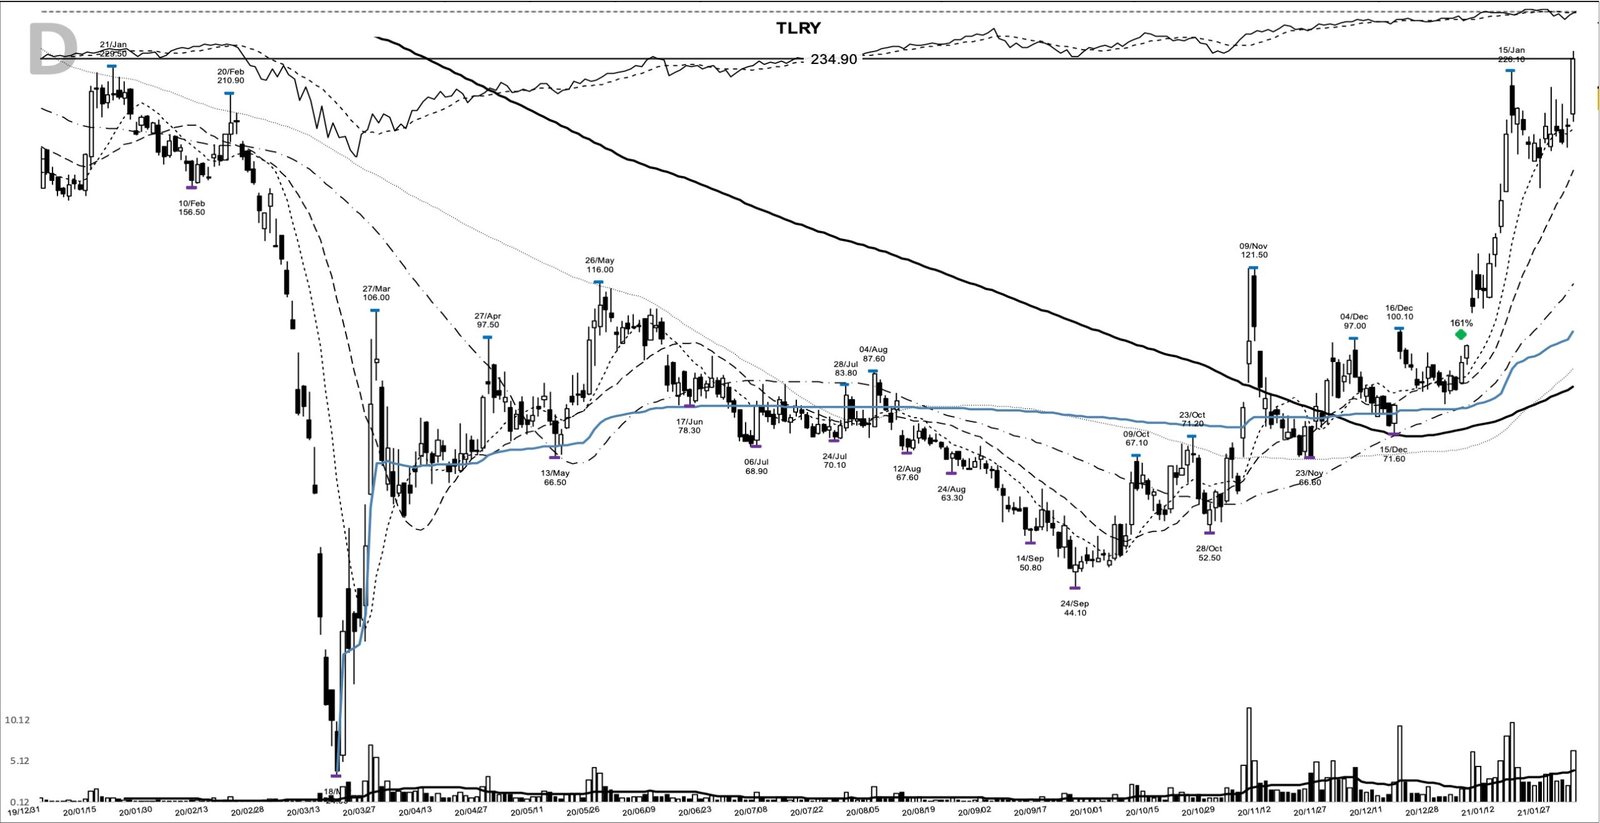
Start at the top left of the chart. TLRY peaked at 229.5 on 21 January 2020, collapsed to 24.3 in the March crash, and then spent most of the year going sideways to lower. The low of the base came on 24 September at 44.1. From there the lows stepped up: 52.5 on 28 October, 66.6 on 23 November, 71.6 on 15 December.
The highs tell a louder story. On 6 November, three days after the US election, the stock opened at 89.8 on 11,555,077 shares, and on 9 November it traded to 121.5 before closing at 101. That spike failed within days. On 16 December the merger with Aphria was announced, and TLRY opened at 99, traded to 100.1, and closed at 93.3 on 9,424,541 shares. That high became the pivot, the prior 20-day high the stock had to close above.
The two weeks after the merger day built a short shelf. Closes held between 82.15 and 89.6, and the low came in at 79.0 on 29 December. On the chart the shorter moving averages below price had curled upward and pulled together, and price had climbed back above the long, heavy moving average that fell through most of 2020.
Then came 4 January. The bar opened at 84.3, traded to 91.9, and closed at 90.00, still below the 100.1 pivot. That makes the study entry an anticipatory one. Volume ran 0.9 times the 20-day average, a quiet day by this stock’s standards. The pivot cleared on 6 January, when the stock opened at 110.2, above the pivot, and closed at 107.7 on 6,173,151 shares.
Tilray and Aphria in the winter of 2020
Tilray was a Canadian cannabis producer that had fallen hard since its 2018 listing, and the business case into this entry rested almost entirely on the merger. Under the deal announced on 16 December 2020, Aphria shareholders would own about 62 percent of the combined company, making it a reverse acquisition with Aphria as the accounting acquirer, per the companies’ SEC filings.
That detail matters for reading the fundamentals. The SEC data now filed under Tilray’s name carries Aphria’s quarters as the accounting predecessor. It shows revenue of 117,490,000 dollars for the quarter ended August 2020 and 129,459,000 dollars for the quarter ended November 2020, with a loss per share in every 2020 quarter. The November figures were published on 14 January 2021, ten days after the entry. The case rested on scale, a merger, and a policy story.
The policy story moved fast. On 6 January, as the Georgia runoff results pointed to a Democratic Senate, cannabis stocks rallied on hopes of a path toward federal legalization, per Motley Fool’s same-day coverage. By early February the retail crowd that had piled into GameStop turned to pot stocks, and Bloomberg reported that merger-arbitrage traders had built short interest in Tilray to 23 percent of available shares.
A market rotating toward small caps in January 2021
The broad market was in an uptrend into the new year, but leadership was shifting toward smaller companies. On 6 January the Russell 2000 posted a record-high rally as the Georgia results came in, per SentimenTrader’s same-day note. Money kept moving into the more speculative corners of the tape, and late January brought the GameStop squeeze, when heavily shorted stocks with a retail following moved more than anything else. A cannabis stock with a fresh merger, a political catalyst, and a large short position sat right in that current.
That same backdrop explains the ending. When the Reddit-driven rotation into cannabis unwound on 11 February, Tilray had its worst day on record, per Bloomberg.
Preparing for TLRY before 100.1 gave way
The trend posture on 4 January was early. The 10-day, 20-day, and 50-day moving averages sat at 85.7, 84.04, and 77.94, stacked in the right order but close together. The 90.00 close was 5.0 percent above the 10-day line, and it was only the first close above that line in the current run. The stock was also still 60.8 percent below its 229.5 high from January 2020, so this was a recovery base, far from new-high territory.
What would have put it on a watchlist was the combination of rising lows from 44.1, a pivot defined by a news-driven volume spike, and a tight shelf under that pivot. Two catalysts hung over the chart: the pending merger and the Georgia runoff on 5 January.
The trade plan a trend follower might have written that day was simple. Entry on a close above the 100.1 pivot. Initial stop below the shelf low of 79.0, with the 44.1 base low marking where the whole structure fails. After that, trail the 10-day moving average, widening to the 20-day once the move was well advanced. That plan would have waited for 6 January and bought at 107.7, 28.7 points above the 79.0 stop. The anticipatory entry at 90.00 sat only 11.0 points above that same stop, a much smaller risk, but it carried the chance that the stock never cleared the pivot at all.
From 90.00 to 670.00 and back to 262.9
A trader using this pattern might have watched for two things after 6 January: closes holding above the old pivot, and the 10-day line rising underneath. Both held. TLRY closed at 150.2 on 13 January and 185.6 on 14 January, and on 15 January it traded to 226.1.
The first test came on 25 January, when the stock dipped to 156 intraday and still closed at 171.85. On 29 January the close at 181 slipped just under the 10-day line. A strict 10-day trail would have ended the trade there, near a 101 percent gain, and missed February.
For anyone following the wider 20-day rule, there was an opportunity to add on 2 February, when TLRY closed at 234.9, 161.0 percent above the first buy and above the 226.1 January high. What followed was a squeeze. The stock closed at 423.5 on 9 February, and on 10 February it opened at 658.3, traded to 670.0, and closed at 639.1 on 19,944,239 shares. The next day it closed at 321.6, roughly half.
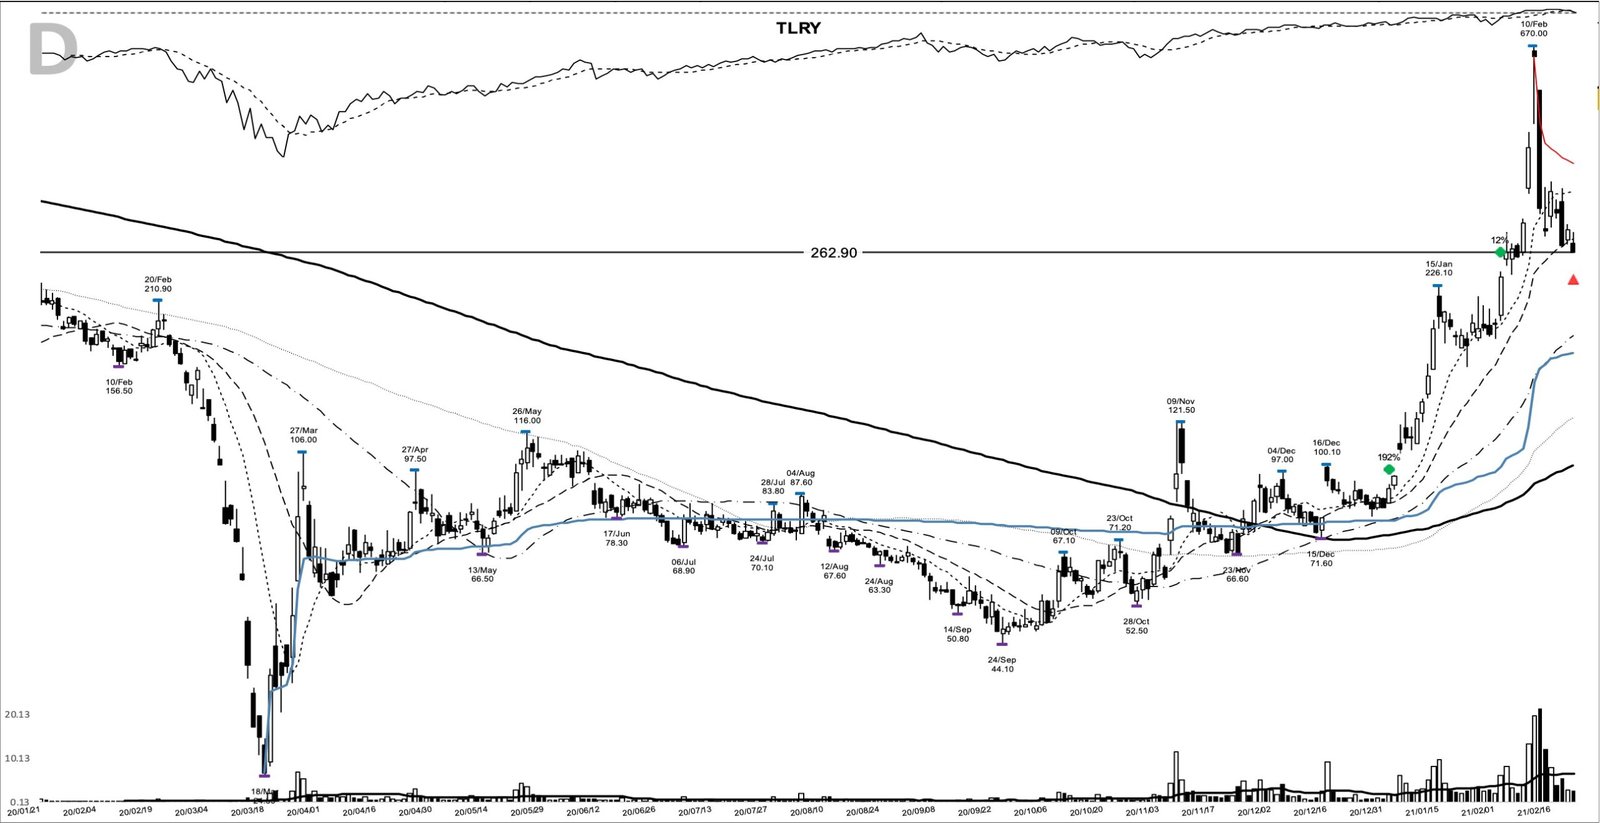
The exit came on 22 February at 262.9, the first close below the 20-day line since the trend began. That closed the move 192.1 percent above the 90.00 entry, 49 calendar days later. Measured against the 670.0 peak, most of the squeeze was given back, and the add from 2 February finished only 11.9 percent higher.
Where the TLRY setup is easy to misread
Volume on the 4 January bar ran below its 20-day average, and the close sat under the pivot, so the bar itself showed no demand. The case for the entry rested on the structure around it, and even then the gap through 100.1 on 6 January needed a political result the chart couldn’t forecast.
The bigger misread comes on 10 February. An open 55 percent above the prior close on 19,944,239 shares is climax behaviour, and a moving-average trail reacts too slowly to capture it. The trail kept a large share of the move from 90.00, and it gave back more than half of the peak. That trade-off is built into trend following.
The fundamentals didn’t carry this one. Losses in every 2020 quarter and a merger-driven story put this chart closer to the GME base breakout than to an earnings leader in the William O’Neil mold.
What TLRY’s squeeze says about trailing a vertical move
This base gave two usable signals, the shelf under 100.1 and the close above it, and the trend did the rest. The harder skill was the exit. The width of the trail decided whether a trader kept 101 percent, 192.1 percent, or watched 670.0 come and go. That rule has to be chosen before the move starts, because a squeeze leaves no time to think. When short interest is part of the fuel, the drop can be as fast as the climb.
Learn the pattern. Ride the trend. Keep the gains.
Related studies: the AMC base breakout of 2021 from the same retail-driven winter, and pyramiding into a position for how add-ons like 2 February fit a plan. A new winner study lands most evenings.
Price and volume figures are computed from split-adjusted daily OHLCV data; company figures come from SEC filings where cited.
Educational content only. Not investment advice. Trading involves risk. You are responsible for your decisions.
Get the free Market Wisdom e-book
Join Trends and Breakouts — historical winners, breakout studies, and risk lessons. No spam, unsubscribe anytime.