DQ is back on traders’ screens this week, so it’s worth pulling up the chart that mattered most. In the summer of 2020 the stock closed at 13.77 on 23 June, clearing a 12.53 pivot it had been capped under for weeks, on volume that ran about double its 20-day average. That single bar opened the DQ base breakout of June 2020: a base breakout that went on to run 591.7 percent over the next eight months, with two clean chances to add as the trend proved itself.
Daqo New Energy makes polysilicon, the raw material behind solar panels, and in mid-2020 it was one of the leaders a recovering market was starting to reward. What’s worth keeping about this chart is how readable it was on the day. The base, the pivot, and the volume expansion were all there before the trend did any of the heavy lifting.
Key takeaways from the DQ base breakout
- The pattern is a base breakout: a multi-month base capped near 12.53, resolved by a 13.77 close on 23 June 2020.
- The breakout bar carried volume of about twice the 20-day average, the kind of demand a clean base breakout wants.
- From the 13.77 breakout, DQ ran to a 130.33 peak on 10 February 2021 before the exit at 95.25, a gain of 591.7 percent over 244 calendar days.
- Two clean chances to add appeared as the trend extended, near a 48.31 close in December and a 62.33 close in early January.
- The takeaway is trend following: buy the confirmed breakout, add into strength, and let a leader run instead of chasing the first spike.
The DQ trade at a glance
| Metric | Value |
|---|---|
| Ticker | DQ |
| Breakout date | 23 June 2020 |
| Breakout close | 13.77 |
| Volume vs 20-day average | 2.0x |
| Exit date | 22 February 2021 |
| Exit close | 95.25 |
| Gain | +591.7% |
| Calendar days | 244 |
| Peak before exit | 130.33 (10 February 2021) |
The charts here come from my study archive.
Inside DQ’s June 2020 base breakout
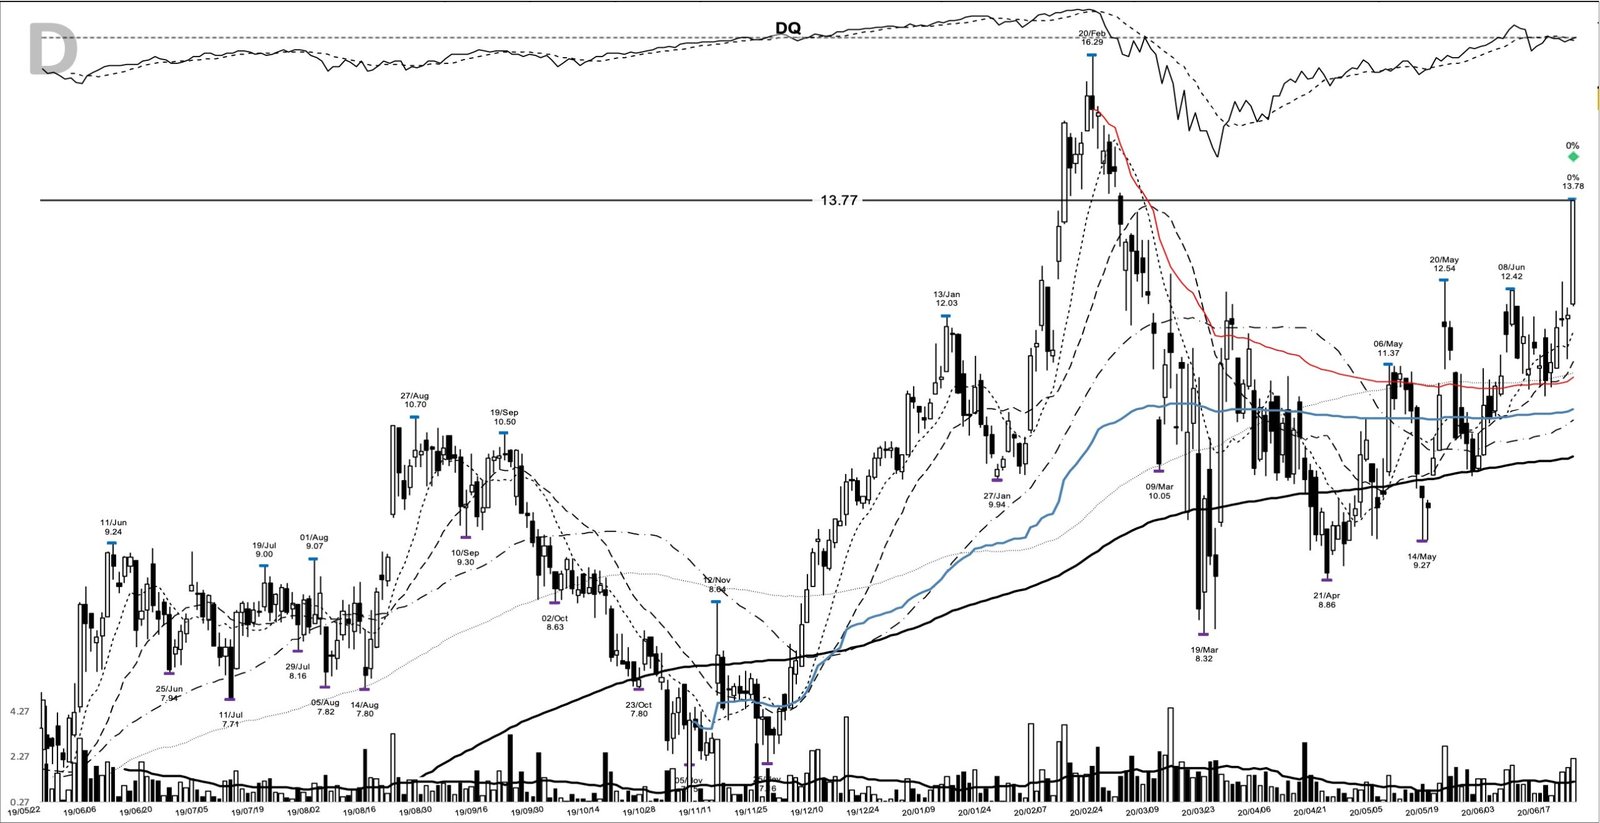
Start with the base. A base breakout is the classic leader pattern William O’Neil built a whole system around, and DQ’s a textbook version of it. Through the second half of 2019 the stock drifted in a wide range in the 7 to 10 area, going nowhere in particular. A February 2020 push tagged 16.29 on 20 February, the prior 52-week high, and then the pandemic crash took the stock all the way down to an 8.32 low on 19 March. Peak to trough, that base runs about 49 percent deep, which tells you how much damage there’d been to repair.
The repair took three months. By late June the price had built a tighter shelf, with a five-day low at 10.97 on 16 June and a recent high of 12.53 on 19 June that formed the pivot. On 23 June the stock opened at 12.20, pushed to 13.78 intraday, and closed at 13.77. This was a confirmed breakout. The close finished above the 12.53 pivot on the same day, so the level was cleared, not just tested.
Volume backs the read. The breakout bar traded about 2.19 million shares against a 20-day average near 1.11 million, an expansion of roughly two times. Underneath price, the moving averages were stacked in the order you’re after: the 10-day near 11.83, the 20-day near 11.42, and the 50-day near 10.68, all rising. One caution sat in plain sight. The close was already about 16 percent above the 10-day line, extended enough that a later chase would’ve paid up.
What Daqo’s polysilicon business looked like in mid-2020
Daqo New Energy is a high-purity polysilicon producer, the feedstock that goes into solar wafers and cells. The business sits in the renewable energy space, with its plants centered in China and its shares listed on the NYSE. Through 2019 it was a small, cyclical name that mostly traded with the price of polysilicon.
Weeks before the breakout, the story started to change. On 5 June 2020 Daqo announced a plan to list its main operating subsidiary, Xinjiang Daqo, on China’s STAR Market within two years, and sold a 4.4 percent stake in that subsidiary to company executives for about 28 million dollars to fund its capital needs. That put a domestic-financing catalyst in front of investors right as expectations for solar demand were firming.
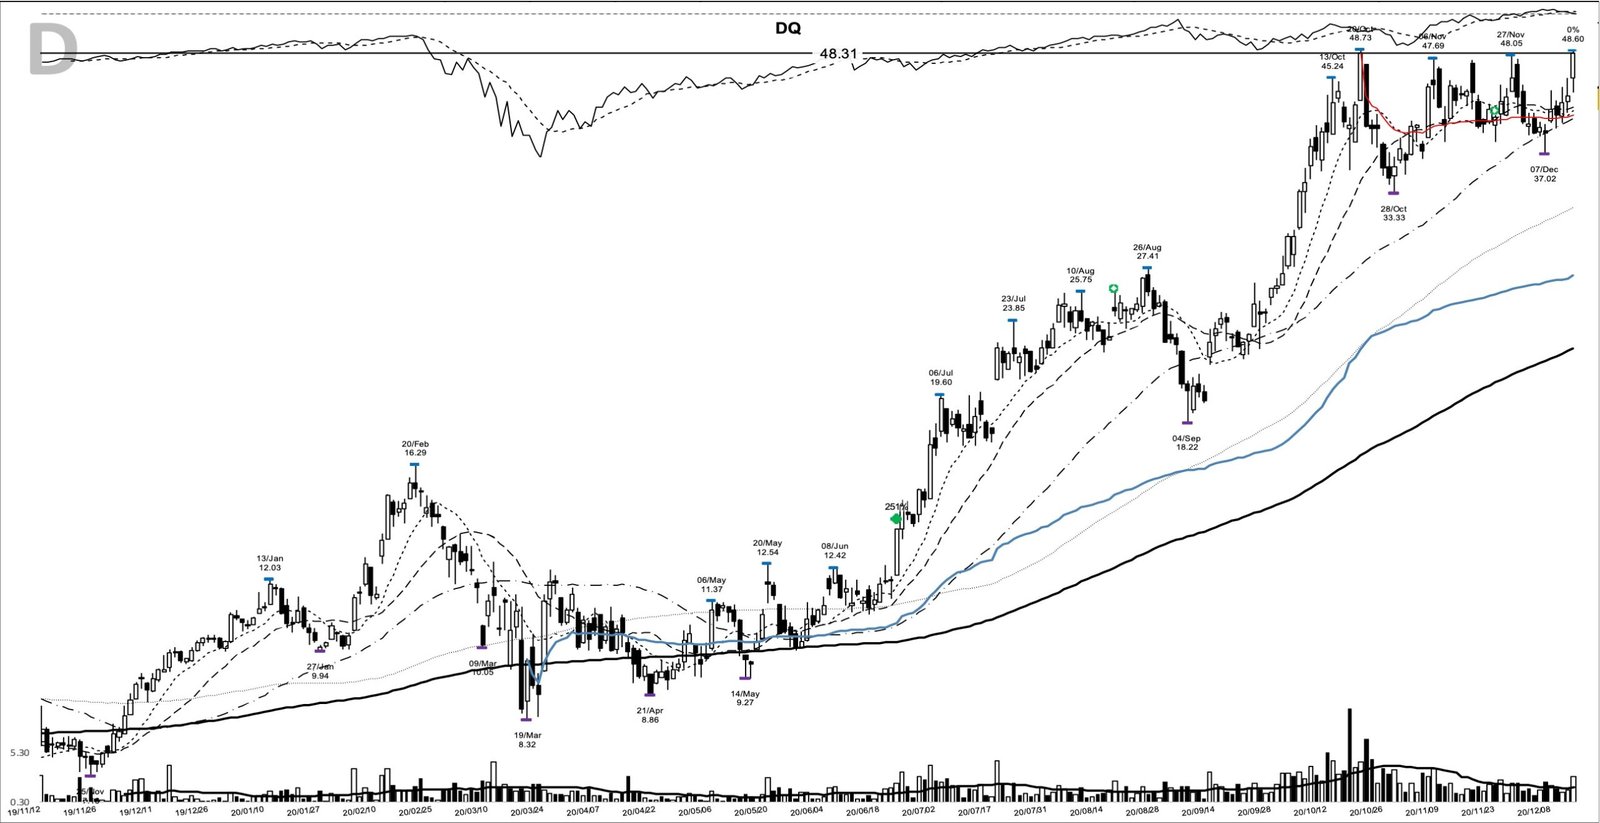
The earnings confirmation came later, during the hold rather than before the breakout. By the fourth quarter of 2020, Daqo was reporting record polysilicon output and sharply higher profit as prices climbed and supply stayed tight. By the time that news was landing, the chart had already done most of its work. By mid-December the stock closed at 48.31, more than triple the breakout, and there was an opportunity to add into the strength.
The June 2020 tape that carried the breakout
No breakout runs in a vacuum, and the June 2020 tape was about as friendly as it gets for a young leader. The market was recovering fast from the COVID crash. The Nasdaq set a record high near 9,925 on 8 June 2020, and the Nasdaq 100 went on to post its best quarter since 2001, helped by reopening optimism and heavy stimulus.
The backdrop wasn’t spotless. COVID case counts turned higher again in the second half of June, and the tape churned around the round 10,000 level on the Nasdaq. Even so, the broad trend still pointed up, and it kept rewarding stocks that were clearing bases on volume. DQ was one of them.
How you could have spotted the DQ setup early
The setup was on a watchlist well before 23 June, if you knew what to mark. Into the pivot, DQ had closed above its 10-day line for four straight sessions, and the 10-, 20-, and 50-day lines were stacked in rising order at 11.83, 11.42, and 10.68. Price was working higher along a defined, rising structure.
The anchors were clear. The six-month base ran from the 16.29 high on 20 February down to the 8.32 low on 19 March, about 49 percent deep. The recent shelf low was 10.97 on 16 June, and the pivot to watch was the 12.53 high from 19 June. A stock repairing a deep base, back above a rising 50-day line and coiling under a clean pivot, is exactly the kind of candidate you’re flagging in advance.
From there the plan writes itself. A trader could’ve entered on a push above the 12.53 pivot, with an initial stop below the 10.97 shelf, or lower under the 8.32 base low where the whole structure fails. Risk from a 13.77 entry to a 10.97 stop is about 2.80 points. After that, the job’s to trail the 10-day line, widening out to the 20-day once the trend’s well advanced, and to let the winner do the rest.
How the DQ trade played out into 2021
After the breakout, the trend extended for months. The advance wasn’t a straight line, and that matters more than the headline number. In late October the stock ran to a 48.40 close on 20 October, then gave back ground to 35.76 by 26 October, a drop of roughly a quarter in four sessions. A stop trailing too tightly would’ve been shaken out right there.
The bigger picture kept trending up. By 14 December the close was 48.31, more than triple the breakout, and by 4 January 2021 it was 62.33, up about 353 percent. That second push offered a second opportunity to add into a proven leader, the kind of adding into strength that’ll turn a good trade into a large one.
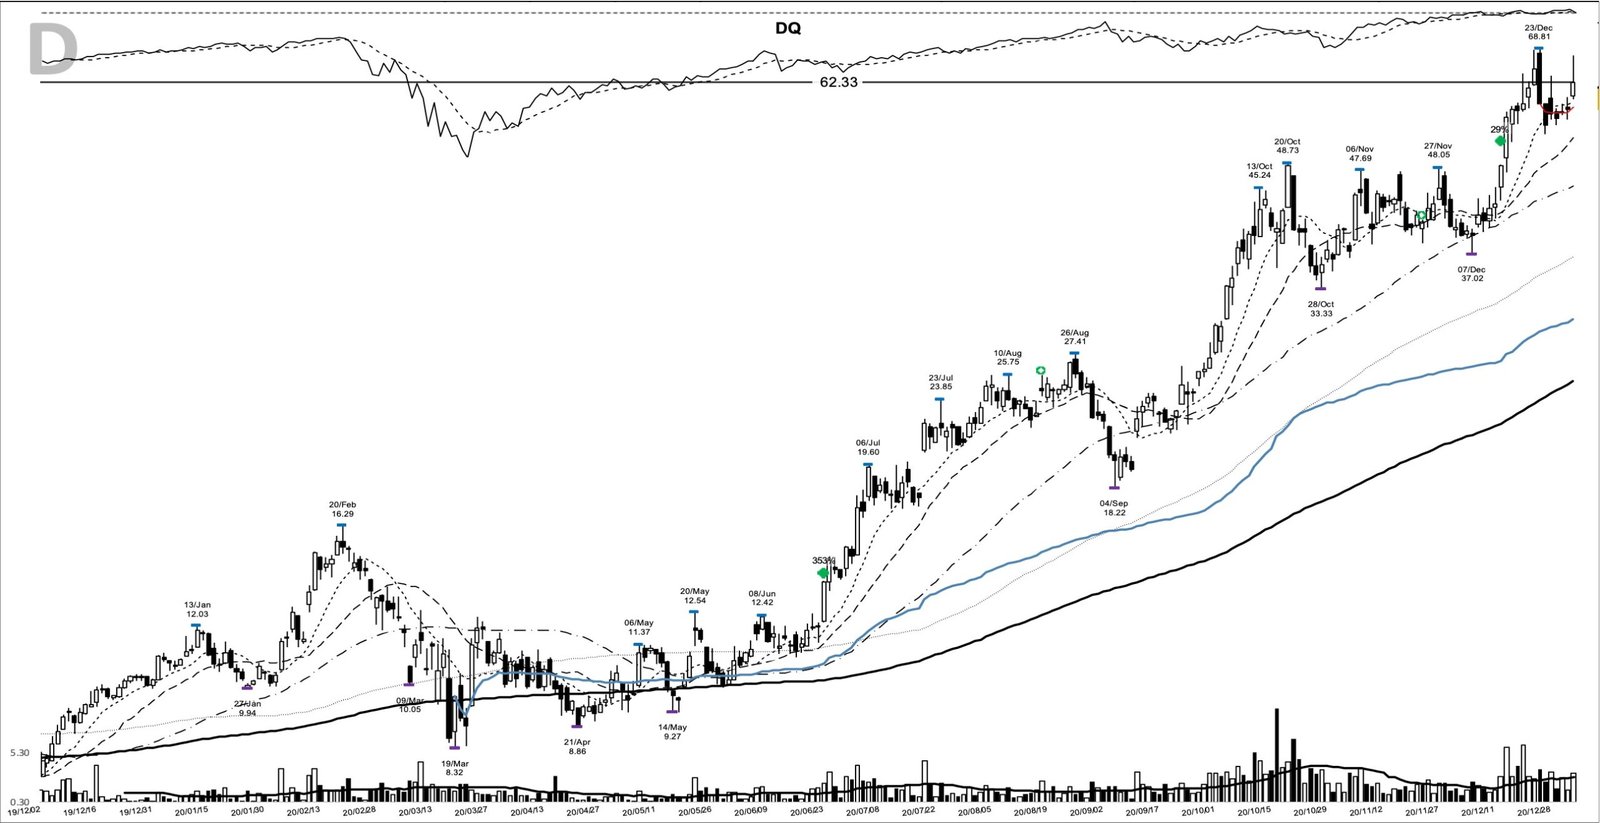
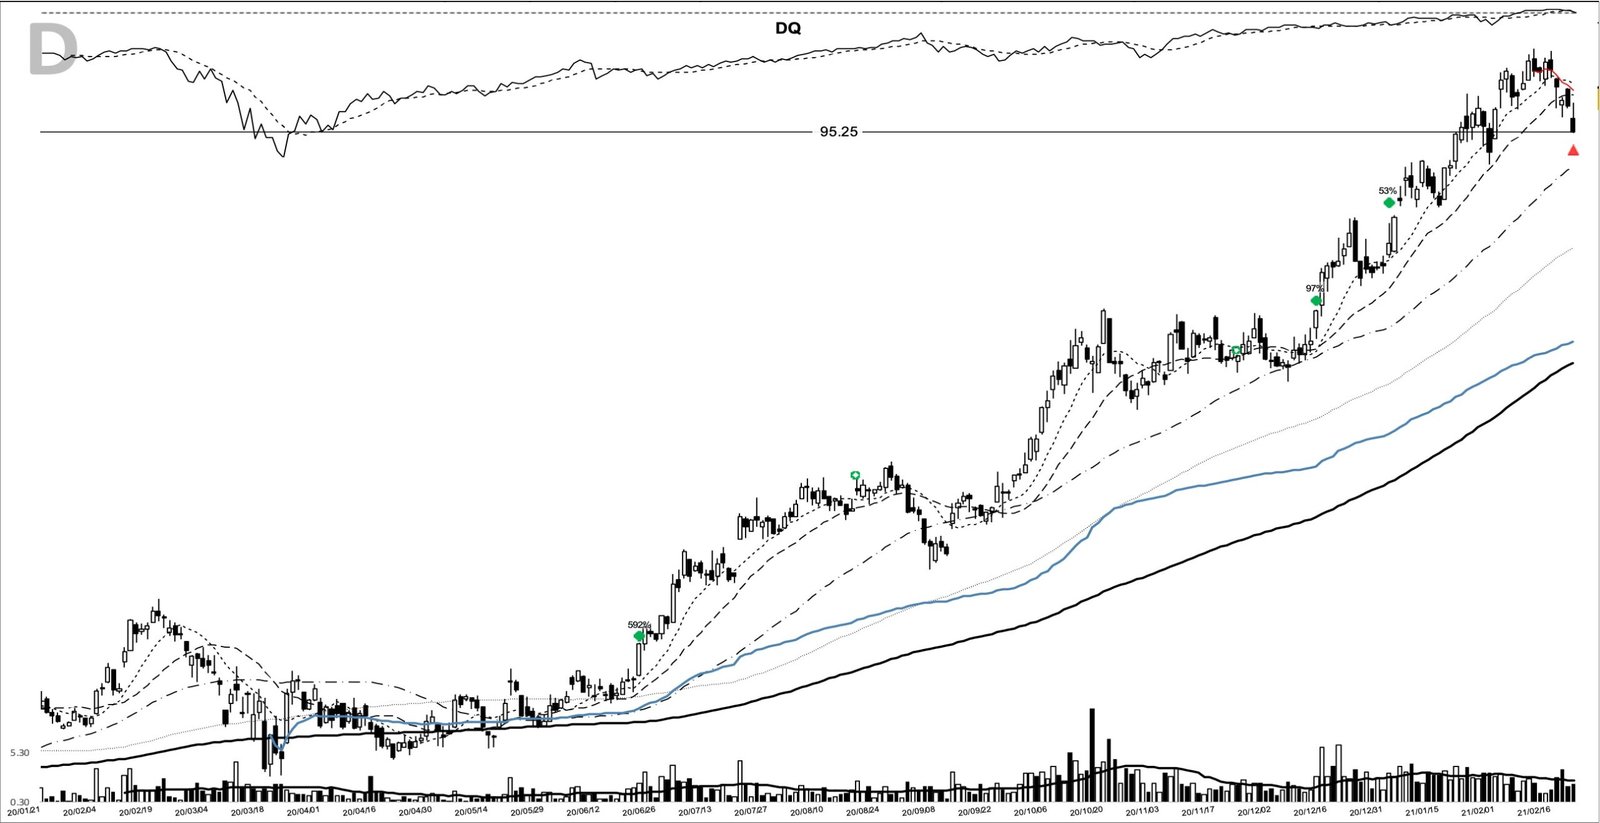
The move topped out with a 130.33 print on 10 February 2021, roughly 846 percent above the breakout. The marked exit came twelve sessions later, on 22 February, at a 95.25 close, a gain of 591.7 percent over 244 calendar days. On paper, 1,000 dollars riding the full move from the breakout would’ve become about 6,900 dollars by that exit.
Where the DQ breakout could have fooled you
The top tick’s never the exit. The high printed 130.33 on 10 February, but the exit at 95.25 came almost two weeks later, well off the top. A base breakout doesn’t hand you the high of the move. Trail a stop and you’ll give some of the final leg back by design, and that’s the honest cost of letting a trend run: the gap between the 846 percent peak and the 591.7 percent realized move.
Chasing was the other trap. The breakout closed about 16 percent above the 10-day line, so buying several days later, after the stock had already stretched into the high teens, meant a worse price and a much wider stop. The clean entry’s at the pivot, not after the move has announced itself to everyone.
The trend also tested conviction more than once. That late-October air pocket from 48.40 to 35.76 was the sharpest drop, and there were smaller shakeouts on the way up. The pattern rewarded patience and a sensible stop under structure, and it punished stops set too tight or placed at random.
What DQ teaches about riding a base breakout
The edge here was all process. A readable base, a defined 12.53 pivot, a 13.77 breakout close backed by roughly double the average volume, a logical stop under the 10.97 shelf, and the patience to add into strength and hold a leader through the noise. That’s trend following in one chart, and it repeats in a way that guessing tops and bottoms never will.
Learn the pattern. Ride the trend. Keep the gains.
Related studies
- FSLR base breakout, March 2007, another solar-supply leader clearing a base.
- RUN base breakout, July 2020, a solar name breaking out in the same window.
- TSLA base breakout, November 2019, the archetype of a base that ran for years.
A new winner study lands most evenings, so there’s usually a fresh chart to work through.
Price and volume figures are computed from split-adjusted daily OHLCV data; company figures come from SEC filings where cited.
Educational content only. Not investment advice. Trading involves risk. You are responsible for your decisions.
Get the free Market Wisdom e-book
Join Trends and Breakouts — historical winners, breakout studies, and risk lessons. No spam, unsubscribe anytime.