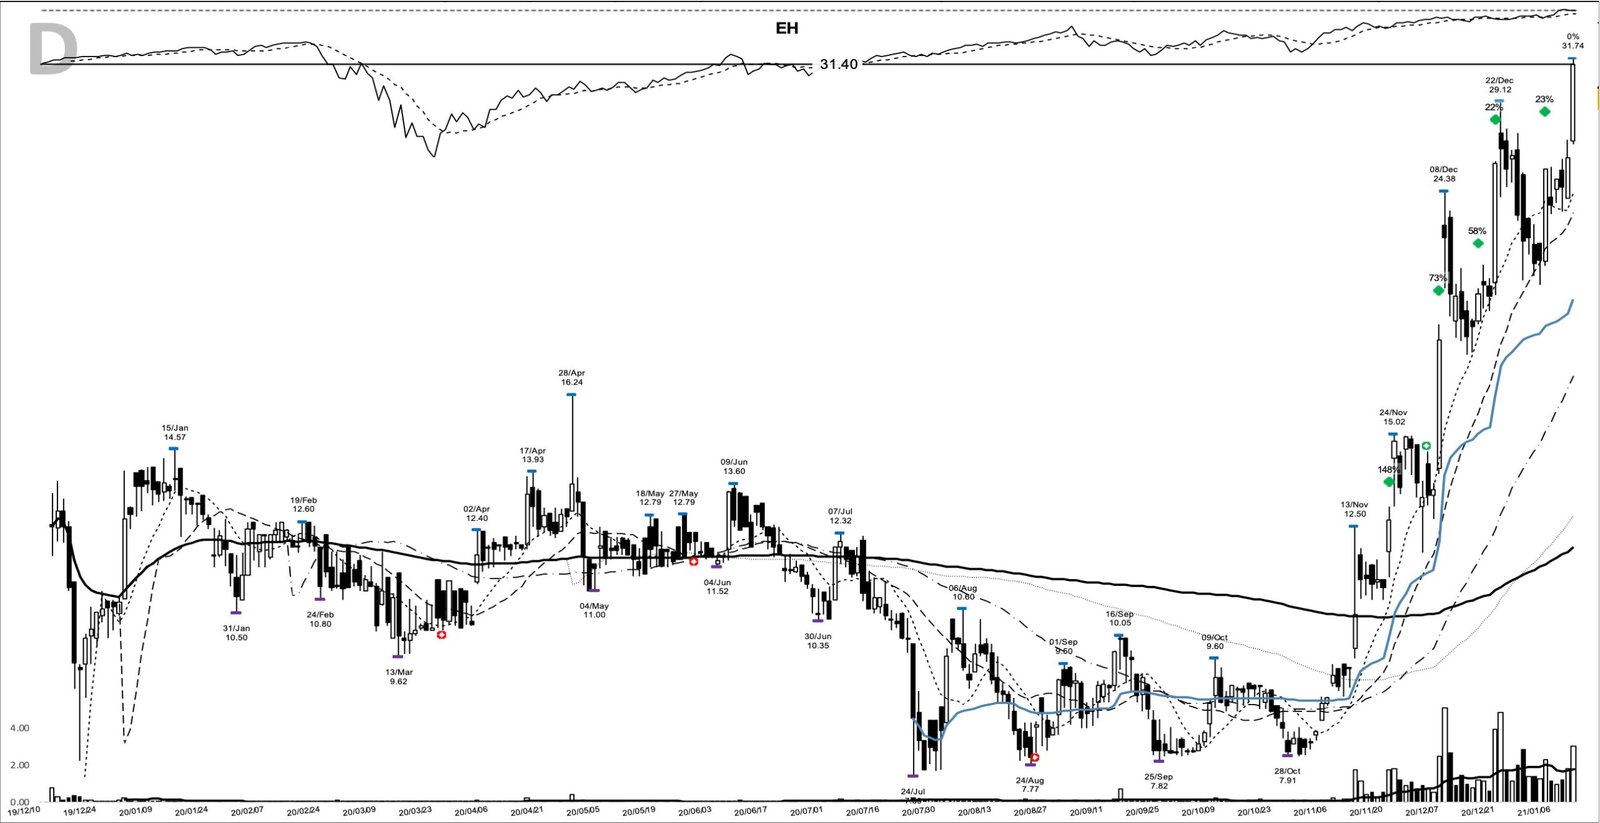
EHang, ticker EH, is back on traders’ screens this week. The Chinese eVTOL maker posted its second-quarter 2026 results on 25 August, per the company’s own release, and the stock climbed the trending lists again. That is reason enough to pull up the chart that put it in the study library in the first place. The EH base breakout of November 2020 is a clean lesson in how a small, recently public momentum name resolves a long base and then runs: an entry on 23 November 2020 at a close of 12.67, a 12.50 pivot cleared on heavy volume, and a move of 265% over the next 85 calendar days.
Key takeaways from EH’s 2020 breakout
- The pattern was a base breakout: a multi-month shelf that resolved higher on 23 November 2020, with the entry-day close at 12.67.
- The move ran 265%, from the 12.67 entry to the 46.30 exit, across 85 calendar days.
- The breakout carried real demand: entry-day volume of 1,715,128 shares ran 5.7 times the 20-day average.
- The trend gave five later points to add as it extended, the first near a close of 18.14 on 7 December 2020.
- Price reached a high of 129.80 before a short-report reversal, and the exit closed the move well below that peak but still well above the entry.
The EH trade at a glance
| Field | Value |
|---|---|
| Ticker | EH |
| Breakout date | 23 November 2020 |
| Breakout close | 12.67 |
| Volume vs 20-day average | 5.7x |
| Exit date | 16 February 2021 |
| Exit close | 46.30 |
| Gain | 265.4% |
| Calendar days | 85 |
| Peak before exit | 129.80 (12 February 2021) |
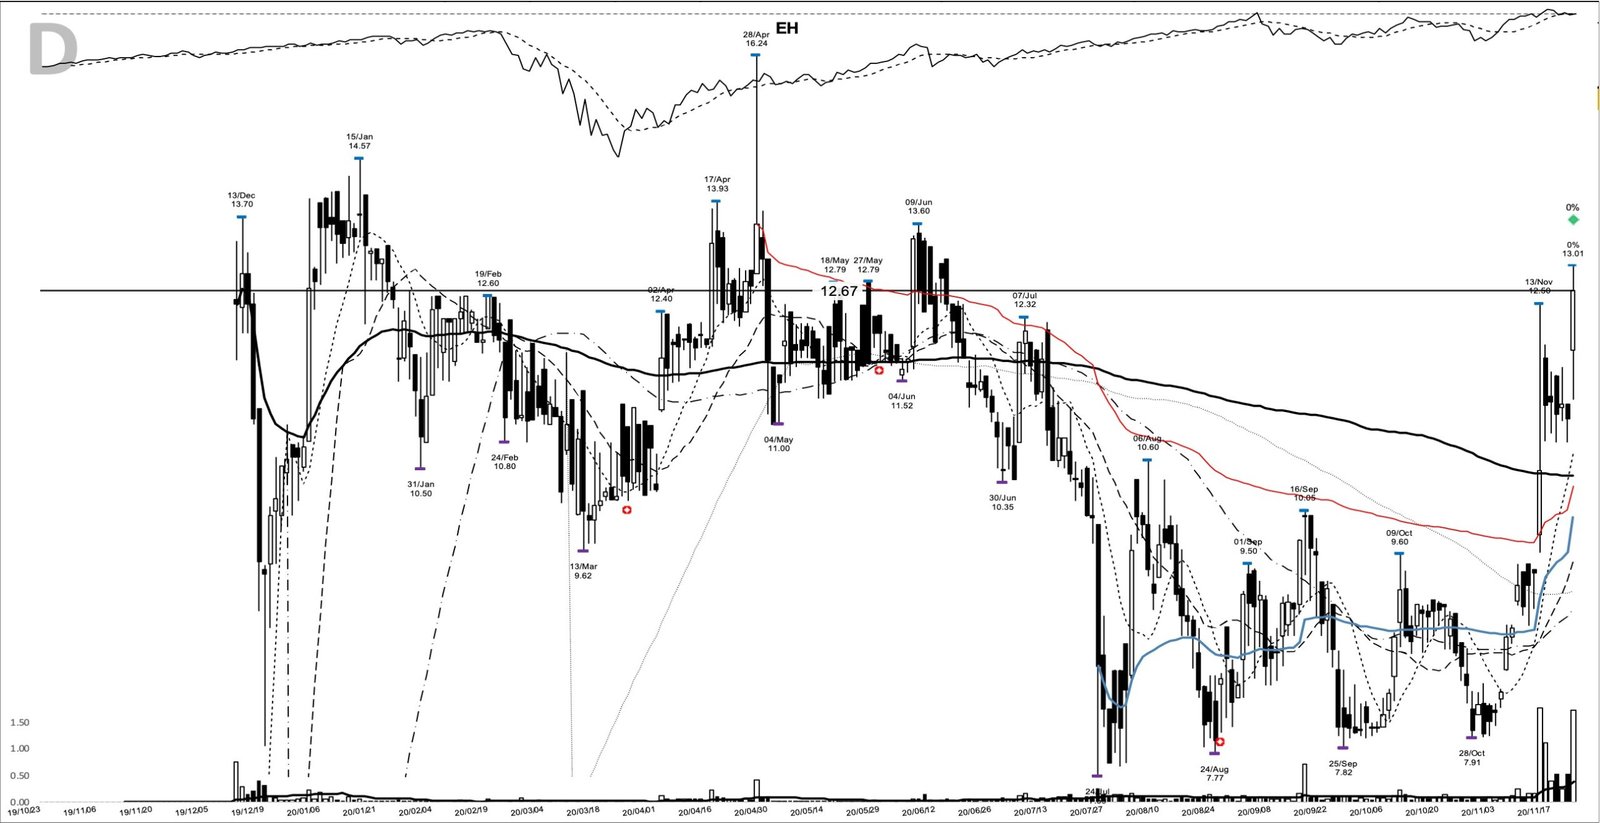
The charts here come from my study archive, each a snapshot at a real decision day on the EH tape.
Inside the EH base breakout
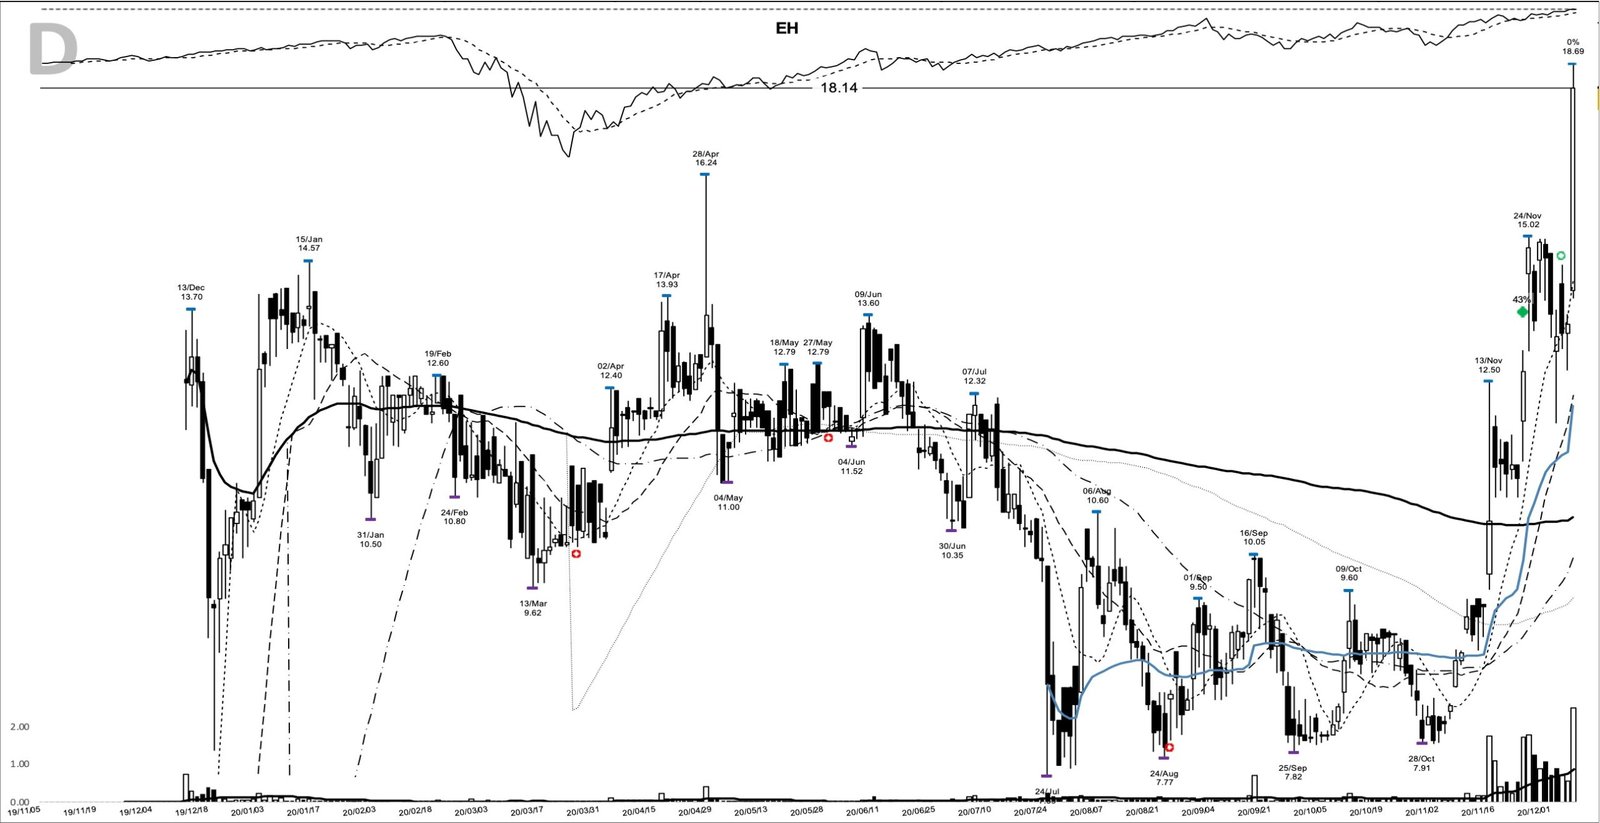
The base ran roughly six months. Price topped at a high of 13.60 on 9 June 2020, then bled down to a low of 7.59 on 24 July, a drawdown of about 44% from top to bottom. That depth matters, and it returns as a warning later.
Into November the stock built a tight shelf. The five sessions before the entry held a low of 10.80 on 18 November, coiling just under the prior 20-day high. That 20-day high, printed at 12.50 on 13 November, was the pivot: the level a close needed to clear to signal the base had resolved.
On 23 November the stock did exactly that. It opened at 11.90, pushed to a high of 13.01, and closed at 12.67, above the 12.50 pivot. This is a confirmed breakout, since the entry-day close cleared the pivot on the same session. The confirmation was in the tape underneath it. Volume printed 1,715,128 shares against a 20-day average of 300,629, so demand arrived at 5.7 times the recent norm. Heavy volume on a breakout is the demand signal a base needs to hold.
The trend posture was already set. Price had closed above its 10-day moving average for 13 straight sessions into the pivot, and the entry close sat about 18.5% above that 10-day line at 10.69, with the 20-day (9.54) and 50-day (9.06) stacked below and turning up. That is the shape William O’Neil built a career around: a quiet base, a defined pivot, and a volume surge on the day the base gives way. SEC filings returned no clean quarterly earnings series for EHang in this window, so this study leans on price and volume rather than an earnings-acceleration table.
EHang: the business behind the ticker in late 2020
EHang Holdings is a Chinese autonomous aerial vehicle company. It went public on Nasdaq in December 2019, and its flagship product was the EH216, a two-seat passenger-grade drone built for autonomous short-hop flights. In late 2020 it was a small, story-driven name, and the story was advanced air mobility: the idea that certified, pilotless air taxis were close.
That is the argument investors were having as the base broke. Bulls saw a first mover in a new category; skeptics wondered whether demonstrations would ever become certified, paying operations. The chart shows where buyers stepped in, and the base breakout stands on its own whatever you make of the flying-taxi thesis.
The tape that carried the EH move
Context helped. Through late November 2020 the broad US market was in a confirmed uptrend, coming out of a follow-through day earlier in the month and a post-election bid. Speculative money was chasing Chinese growth and electric-vehicle names hard, and a newly public autonomous-flight story fit that appetite. For a same-theme comparison, the NIO base breakout of May 2020 shows the same speculative bid working through a larger Chinese name earlier that year.
How a trader could have prepared for the 12.50 pivot
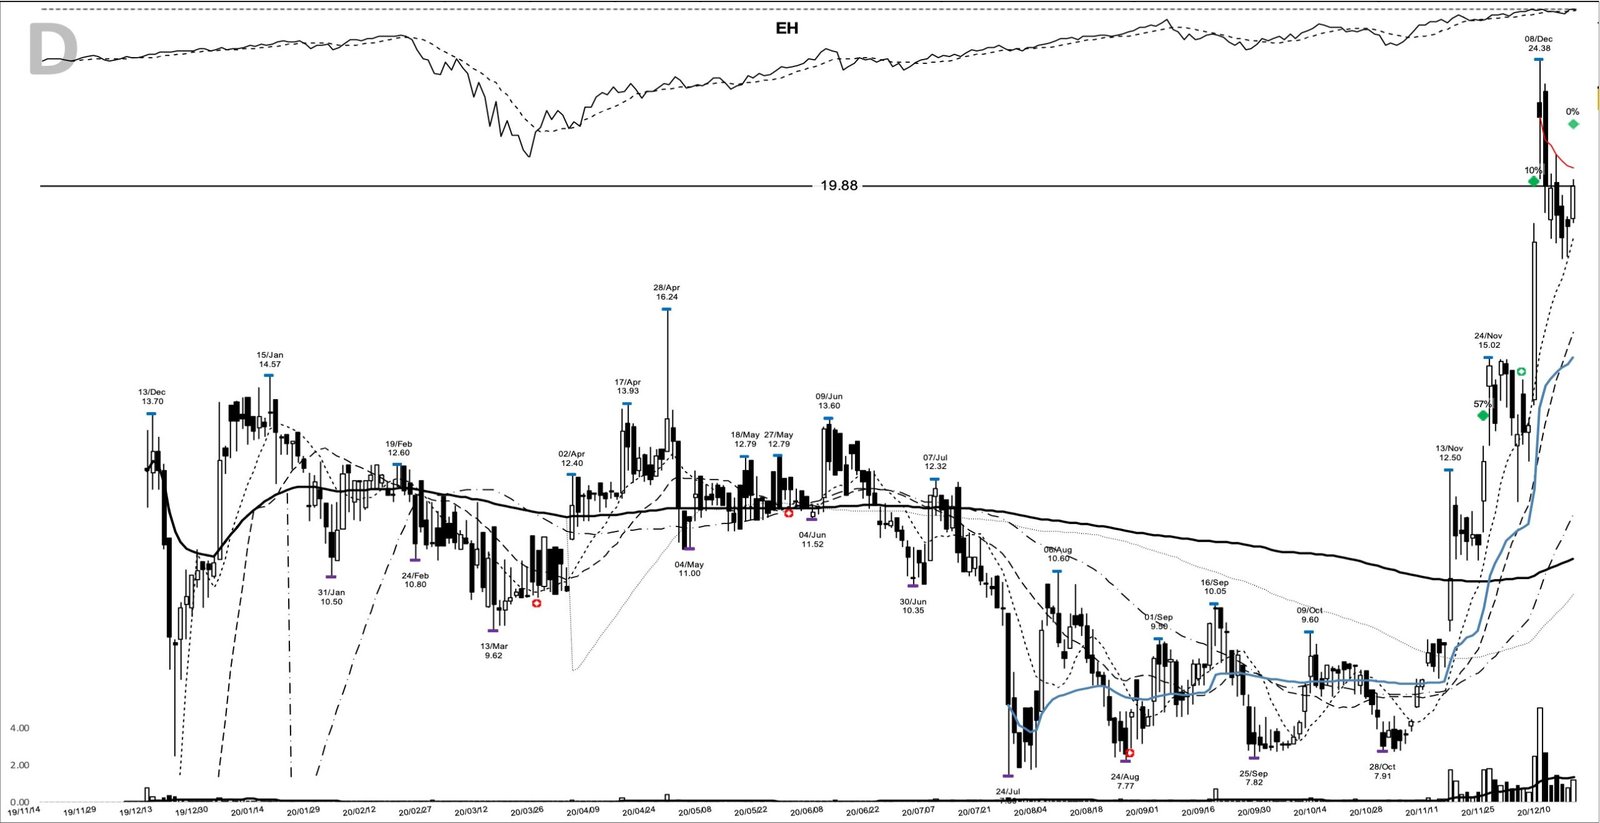
Everything needed to plan this trade was visible before the breakout. The stock had spent months building a base, then coiled into a five-day shelf above a rising set of moving averages. Thirteen straight closes above the 10-day line said buyers were defending every dip. The tell to put it on a watchlist was that quiet shelf sitting right under the 12.50 pivot, with volume drying up as price tightened.
From there the plan writes itself. A trader using this pattern might have set the entry on a move above the 12.50 pivot, placed the initial stop below the 10.80 shelf low, and treated the 7.59 base low as the deeper line where the whole structure would have failed. After that, the job is to trail rather than target: hold against the rising 10-day moving average early, then widen the trail to the 20-day once the move ran well clear of the base. A stop that ratchets up with price is what lets a winner run while capping the giveback, and it is worth reading how a volatility-based stop keeps that trail honest.
How the EH trade played out
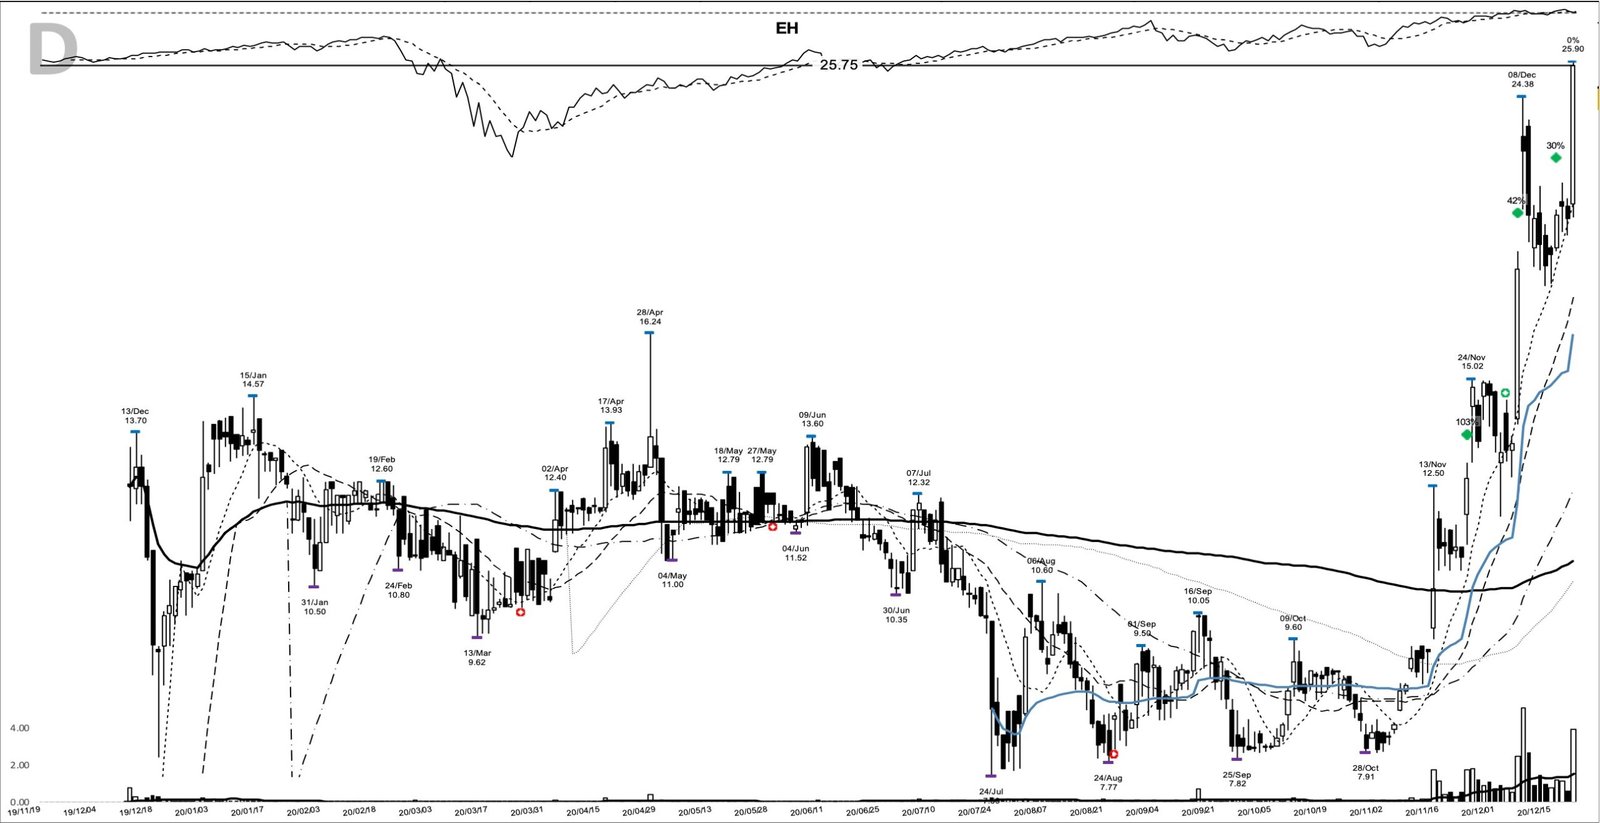
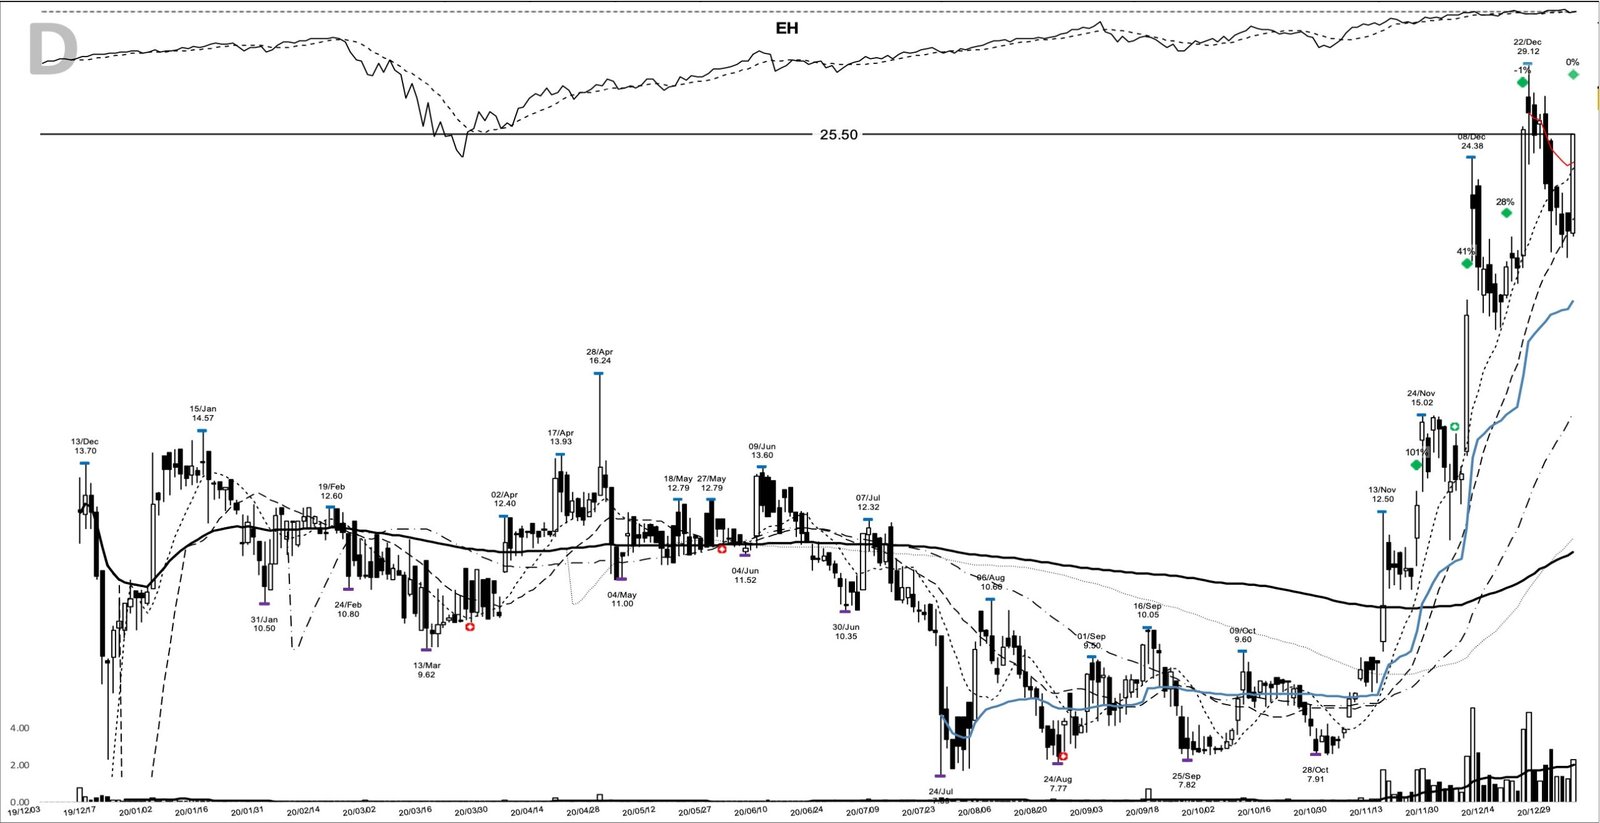
From the 12.67 entry the stock trended, and the trend kept offering places to press. A trader following this pattern might have watched for orderly pullbacks that held above the rising 10-day line, and the tape delivered several. The evidence marks add-on points at closes of 18.14 (7 December), 19.88 (16 December), 25.75 (21 December), 25.50 (5 January 2021), and 31.40 (12 January). Each one was a chance to add into strength rather than chase; the mechanics of scaling up on the way are covered in pyramiding into a position.
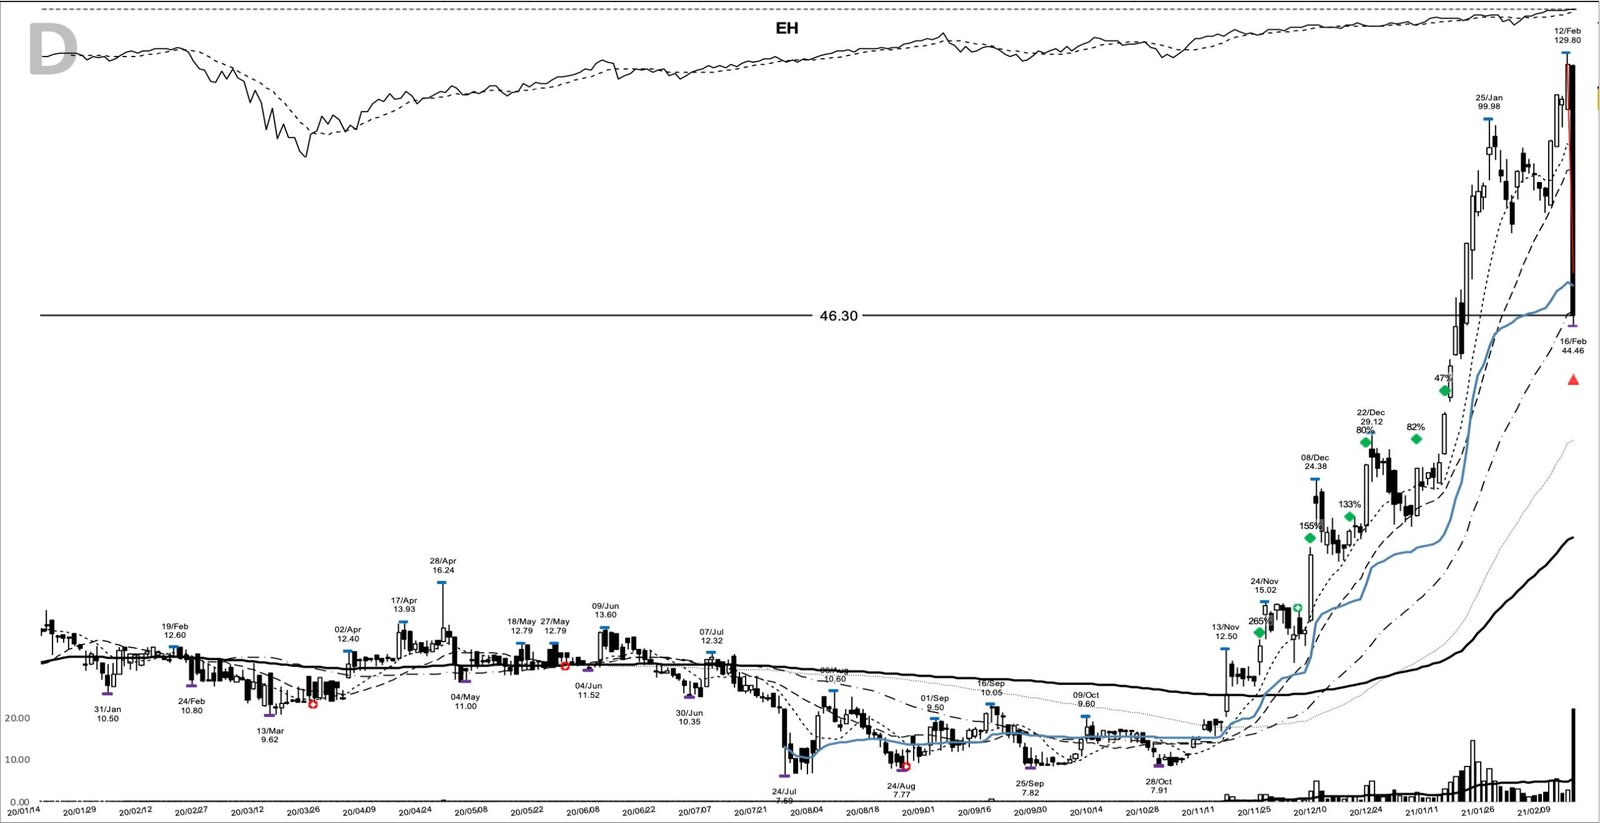
The advance then went vertical. Through late January and early February the stock detached from every moving average, and on 12 February 2021 it printed a high of 129.80, more than 900% above the entry. That is where the study stops being a story about a base and becomes a story about an exit.
On 16 February 2021 a short-seller report hit the wire, alleging that EHang’s revenue and contracts were overstated. The reaction was violent. The stock opened near 123.50, traded down to 44.46, and closed at 46.30, a drop of about 63% in a single session on 22,196,597 shares, its heaviest volume of the entire run. The marked exit closed the move at that 46.30, still 265% above the 12.67 entry, though far below the 129.80 peak four sessions earlier. On paper, 1,000 riding the full move from entry to exit would have become about 3,654.
What the EH chart did not promise
Read this setup honestly and it warns you as much as it teaches. The base was deep, about 44% top to bottom, and deep bases fail more often than shallow ones; the clean resolution here does not make every 44% base a launchpad. The breakout was a legitimate entry, not a promise of a nine-fold peak.
The extension was the second trap. By late December price had doubled and sat far above the 10-day line, and chasing there meant buying into the sharp pullback that followed, when the stock swung from 27.40 down to 20.42 intraday inside a couple of sessions. Adding into strength is a plan; chasing an already extended stock is a different thing.
The exit is the third lesson. Heavy volume confirmed demand on the breakout, yet the single heaviest volume day of the whole move was the collapse, so volume alone never guaranteed safety. The 16 February reversal came on a short-seller report, and no chart could have called the exact top in advance. The trailing exit fired on the way down, not at the high, and that is the normal outcome. You capture the middle of a move; you do not sell the top.
Riding a winner without catching the top
The EH base breakout gave a defined entry at the 12.50 pivot, a defined risk under the 10.80 shelf, and then a trend that did the heavy lifting. The discipline was to enter on confirmation, add into strength, and let a rising stop decide when the run was over. That is the whole game with this pattern. Learn the pattern. Ride the trend. Keep the gains.
Related studies worth reading next: the TSLA base breakout of November 2019 for the same pattern on a much larger run, the QS base breakout of November 2020 for a same-month speculative name, and the NIO base breakout of May 2020 for the wider Chinese-growth theme. A fresh winner study lands here most evenings.
Price and volume figures are computed from split-adjusted daily OHLCV data; company figures come from SEC filings where cited.
Educational content only. Not investment advice. Trading involves risk. You are responsible for your decisions.
Get the free Market Wisdom e-book
Join Trends and Breakouts — historical winners, breakout studies, and risk lessons. No spam, unsubscribe anytime.