FUTU is back near the top of the day’s gainers, and that pulls a familiar chart out of the archive. Long before Futu Holdings was posting record quarters, the FUTU base breakout of May 2020 was one of the cleaner trend setups on the board: a year-long floor, a quiet push through a well-defined pivot, and a run most traders would never sit through. Here is the whole arc in a line. A base breakout on 7 May 2020 at a close of 11.11 cleared the 10.95 pivot, and price ran 1,169.8% over roughly 300 calendar days into early 2021.
The fresh attention on the stock follows record second-quarter results the company reported on 20 August 2026. The setup below is old, but it is a good chart to keep on hand every time the ticker lights up again.
Key takeaways from FUTU’s 2020 run
- The pattern: a deep, roughly year-long base off the March 2020 low, resolved by a 7 May 2020 close of 11.11 that cleared the 10.95 pivot.
- The move: +1,169.8% from that breakout close to the 3 March 2021 exit at 141.05, held about 300 calendar days.
- Volume was quiet on the breakout day, running only about 1.2 times the 20-day average, so this was not the textbook high-volume confirmation.
- Four points along the way (2 July, 29 July, 5 November and 30 December 2020) offered chances to add as the trend extended.
- Price peaked at 199.54 on 10 February 2021 before the trend broke, a reminder that the exit matters as much as the entry.
FUTU at a glance: the breakout to the exit
| Field | Value |
|---|---|
| Ticker | FUTU (Futu Holdings) |
| Breakout date | 7 May 2020 |
| Breakout close | 11.11 |
| Volume vs 20-day average | 1.2x |
| Exit date | 3 March 2021 |
| Exit close | 141.05 |
| Gain | +1,169.8% |
| Calendar days held | 300 |
| Peak before exit | 199.54 (10 February 2021) |
The chart into the 7 May 2020 breakout
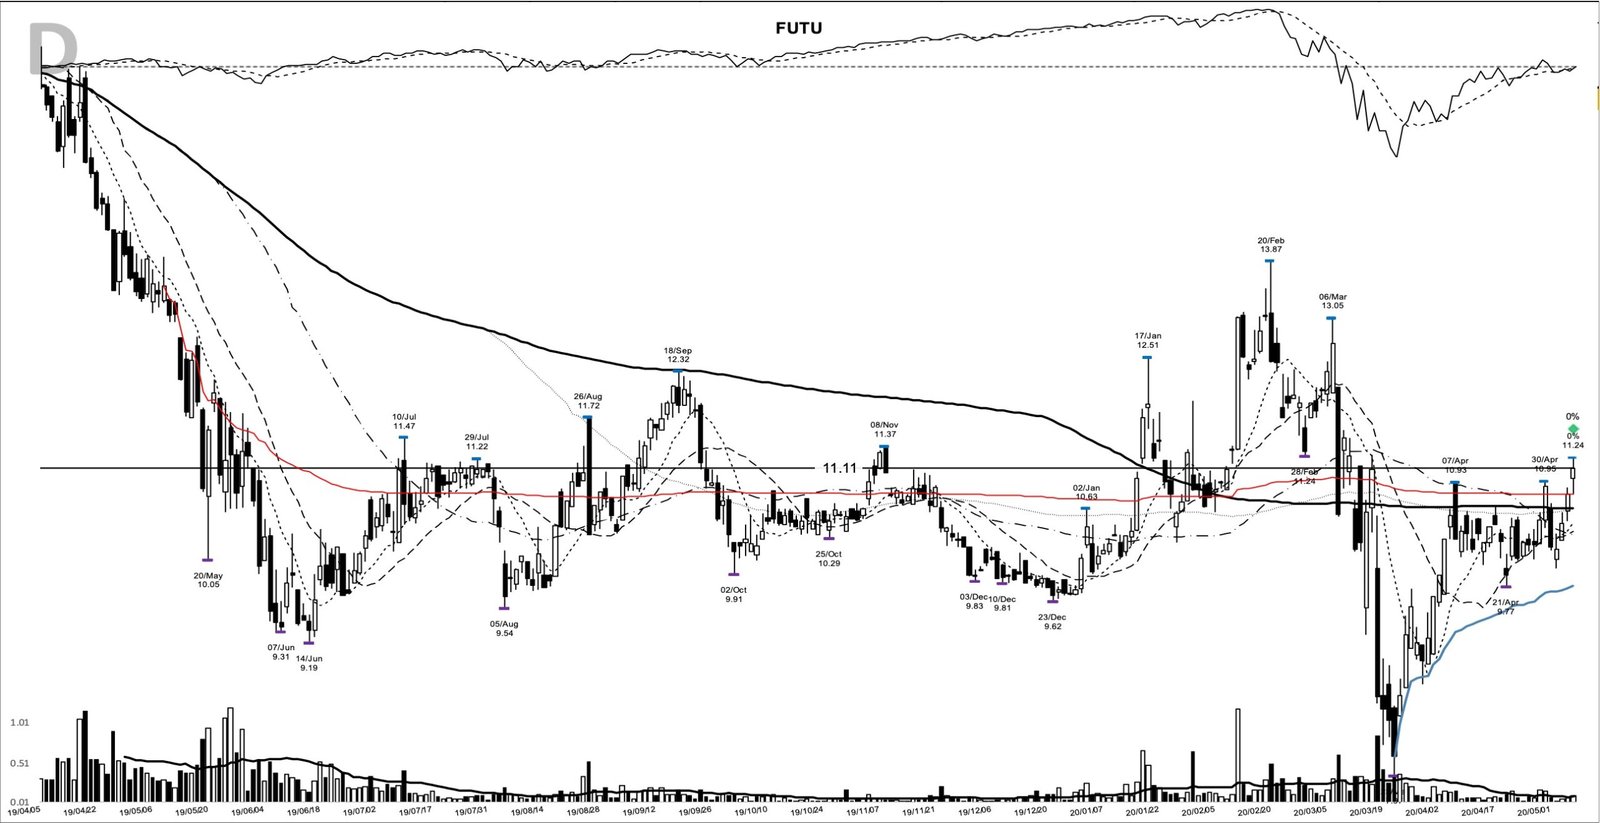
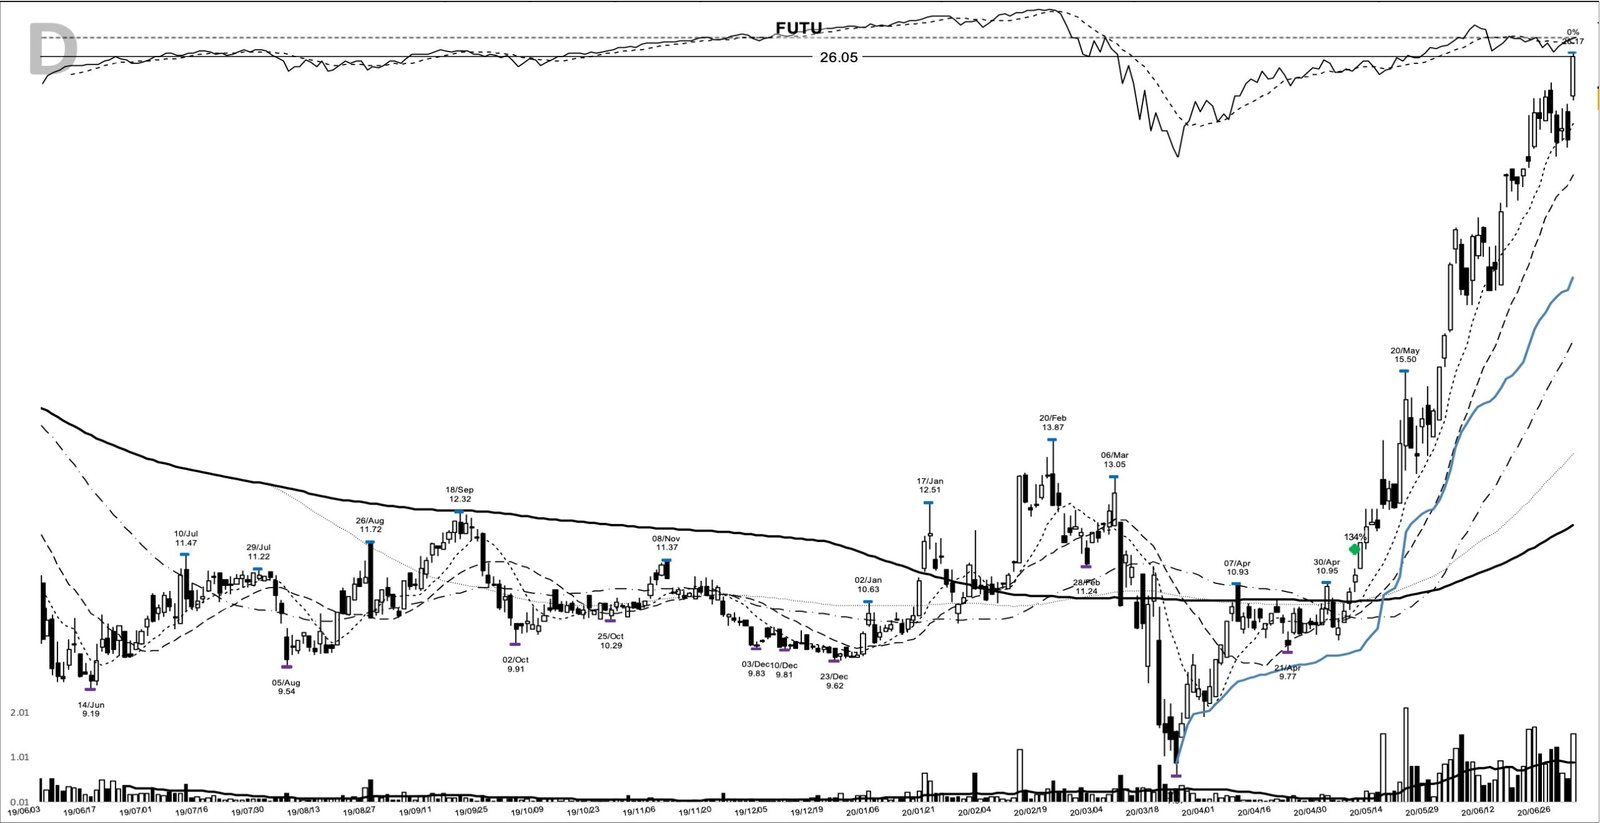
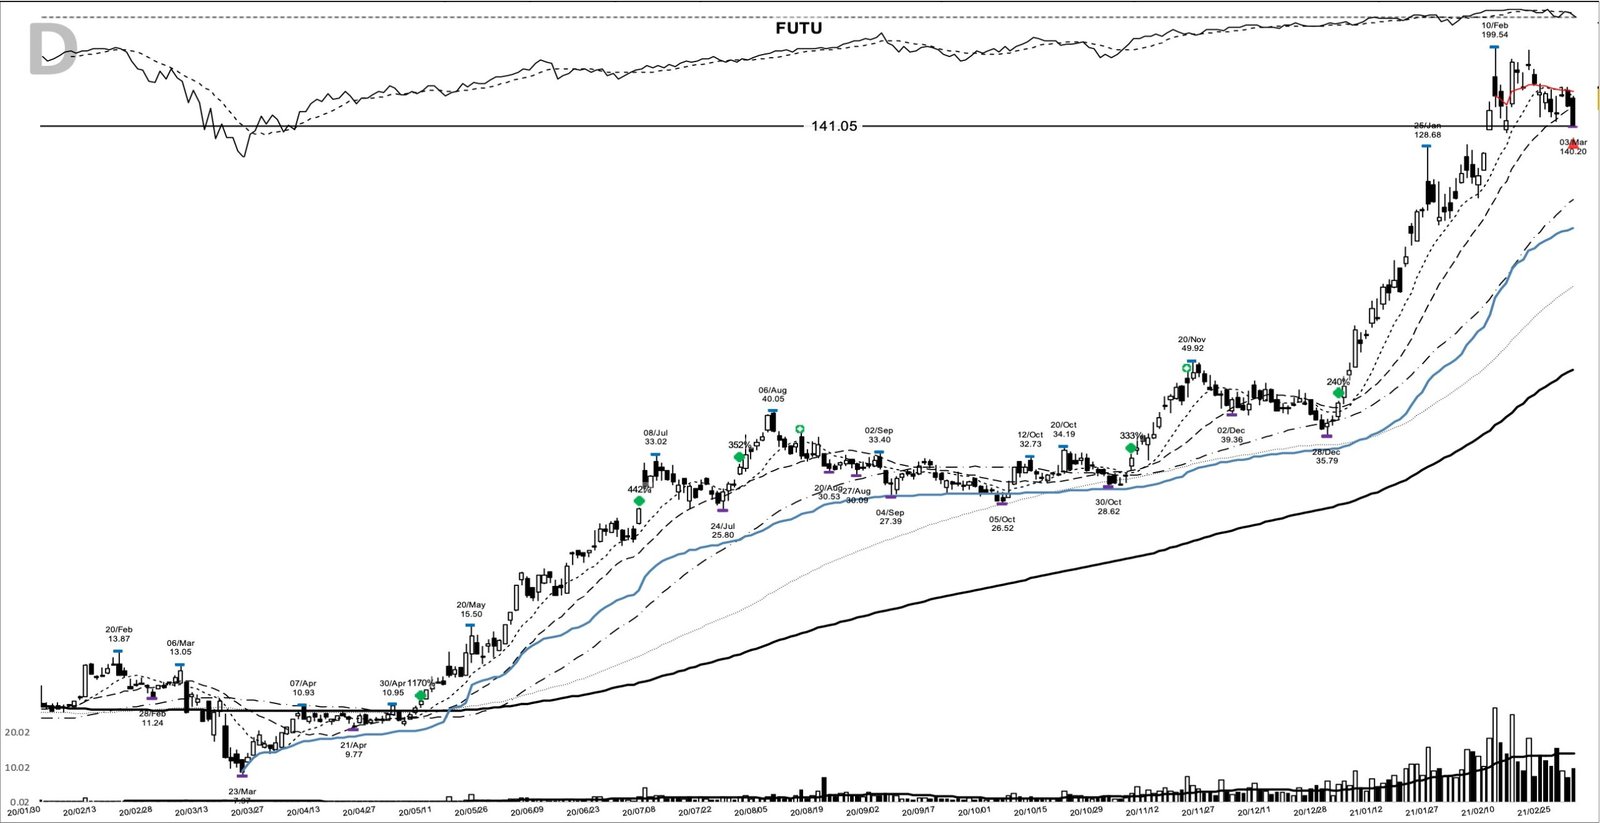
The chart below comes from my study archive. Read left to right, it tells a simple story. FUTU fell for the better part of a year from its 2019 high near 13.95, flattened out through late 2019, then took a violent leg lower in the March 2020 crash, printing a low at 7.97 on 23 March. What follows is the recovery that set up the trade.
By early May the price had climbed back to sit just above a tight cluster of short and medium moving averages, with the long, slow line flattening after its long decline. The horizontal line drawn at 11.11 marks the entry. Just under it, the 30 April marker at 10.95 shows the pivot the stock had to clear.
Anatomy of the FUTU base breakout
The base ran deep. Measured across the six months into the entry, the high was 13.87 on 20 February 2020 and the low was 7.97 on 23 March 2020, a drawdown of about 42.5% inside the base. Bases that deep, carved by a fast market-wide panic, are recovery structures rather than tidy flat shelves, and they carry more failure risk than a shallow one.
The pivot itself was clean. Over the 20 sessions before entry, the highest print was 10.95, set on 30 April 2020. On 7 May the stock closed at 11.11, finishing above that level. That makes this a confirmed breakout: the entry-day close finished above the pivot, a genuine clearance. The 7 May close of 11.11 is the entry reference for every return that follows.
The one soft spot was volume. The breakout day traded about 1.2 times its 20-day average, short of the heavy demand a textbook breakout wants to see. Honest reading of volume matters here: quiet volume is a caution flag, not confirmation, and it is worth naming plainly. Base breakouts of this kind sit at the center of the classic William O’Neil playbook, where the tell is usually a surge in trade. This one worked without it.
What Futu’s business was doing into the entry
Futu Holdings runs an online brokerage app aimed at a young, largely Chinese and Hong Kong retail base. The industry tag on this setup reads financial technology and infrastructure, which is the plain description of what the company sells: a place to trade.
The breakout landed in the middle of a retail-trading boom. Housebound investors were opening accounts and dealing at a pace the brokers had not seen. One week after the 7 May entry, Futu reported first-quarter results that showed revenue more than doubling from a year earlier and a sharp jump in paying clients, per the company’s 14 May 2020 release. The chart moved first, and the fundamentals confirmed the story a week later. That order, price leading the news, is the pattern worth internalising.
The market backdrop in May 2020
The tape helped. By early May 2020 the major indexes had turned up hard from the late-March low, the April rally had held, and leading growth names, many of them tied to a suddenly online economy, were breaking out ahead of weak economic data. A rising market forgives a lot, and it gives a fresh breakout room to work. That backdrop is context, not a guarantee, and the same setup in a heavy tape reads very differently.
How a trader could have prepared for the breakout
The preparation was visible before the entry bar. Into the pivot, price had closed above its 10-day line for three straight sessions, and it sat about 6% above that line on the entry day. The 10-, 20- and 50-day moving averages had bunched into a tight band between 10.34 and 10.48, the kind of coil that often precedes a resolution. A trader watching this could have flagged the stock the moment it started pressing the top of its range.
The anchors on the chart wrote the plan. The pivot was the 20-day high of 10.95 from 30 April 2020. The nearest shelf was the five-day low of 9.97 from 4 May 2020. The deeper structural line was the base low of 7.97 from 23 March 2020, the level where the whole recovery thesis fails.
From there a trend follower could have set it out plainly. Enter on strength above the 10.95 pivot. Place the initial stop below the 9.97 shelf, with the 7.97 base low as the deeper invalidation. Then trail the rising 10-day line, widening to the 20-day once the move is well advanced, and let the trend decide the hold. This is ordinary trend following, written in advance so the exit is a rule rather than a reaction.
How the FUTU trade played out
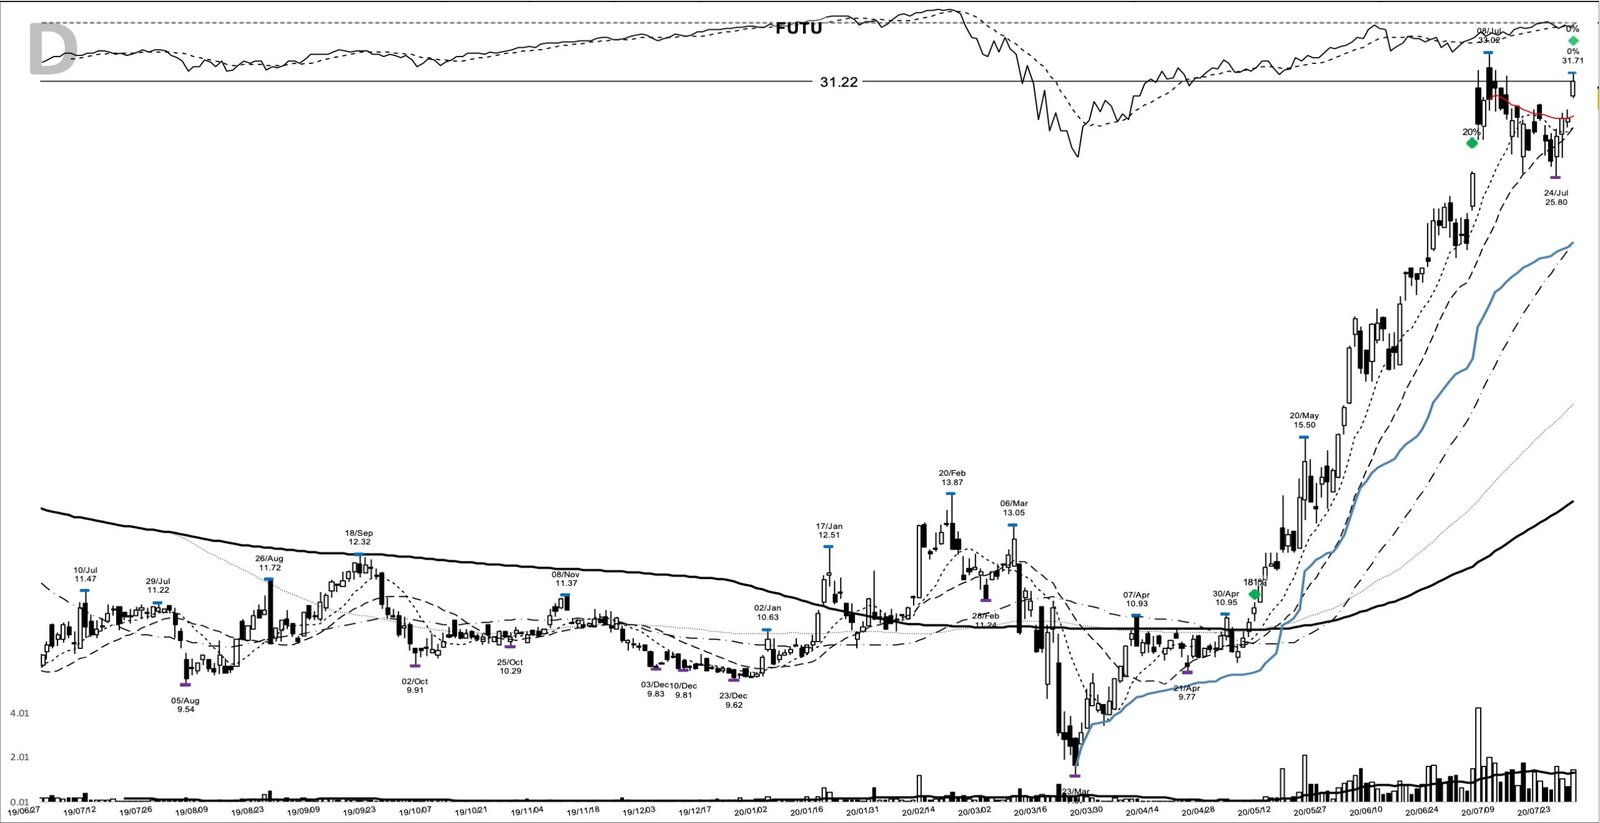
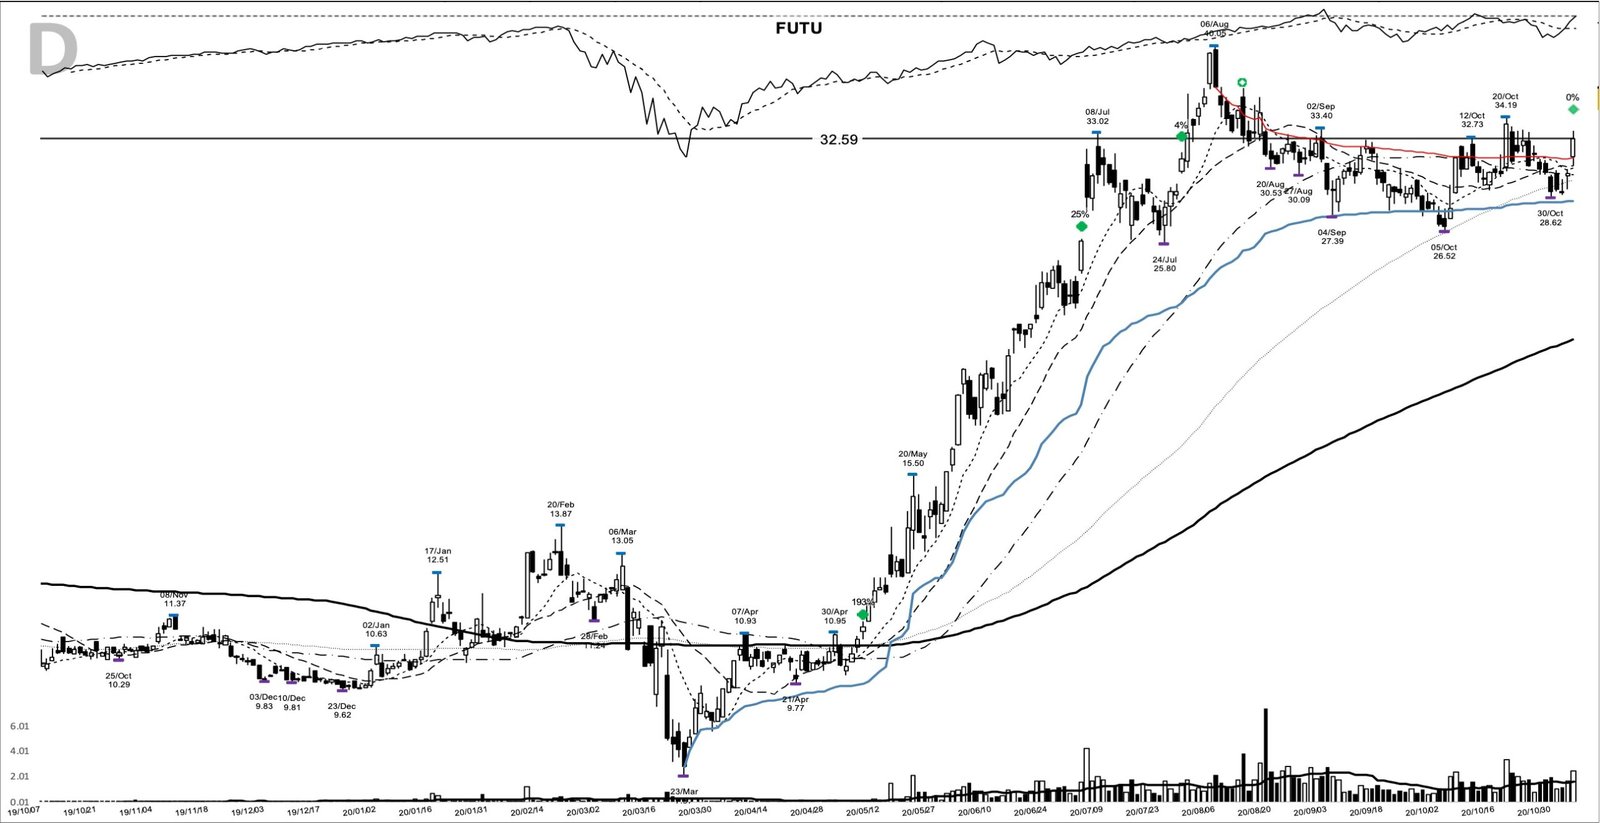
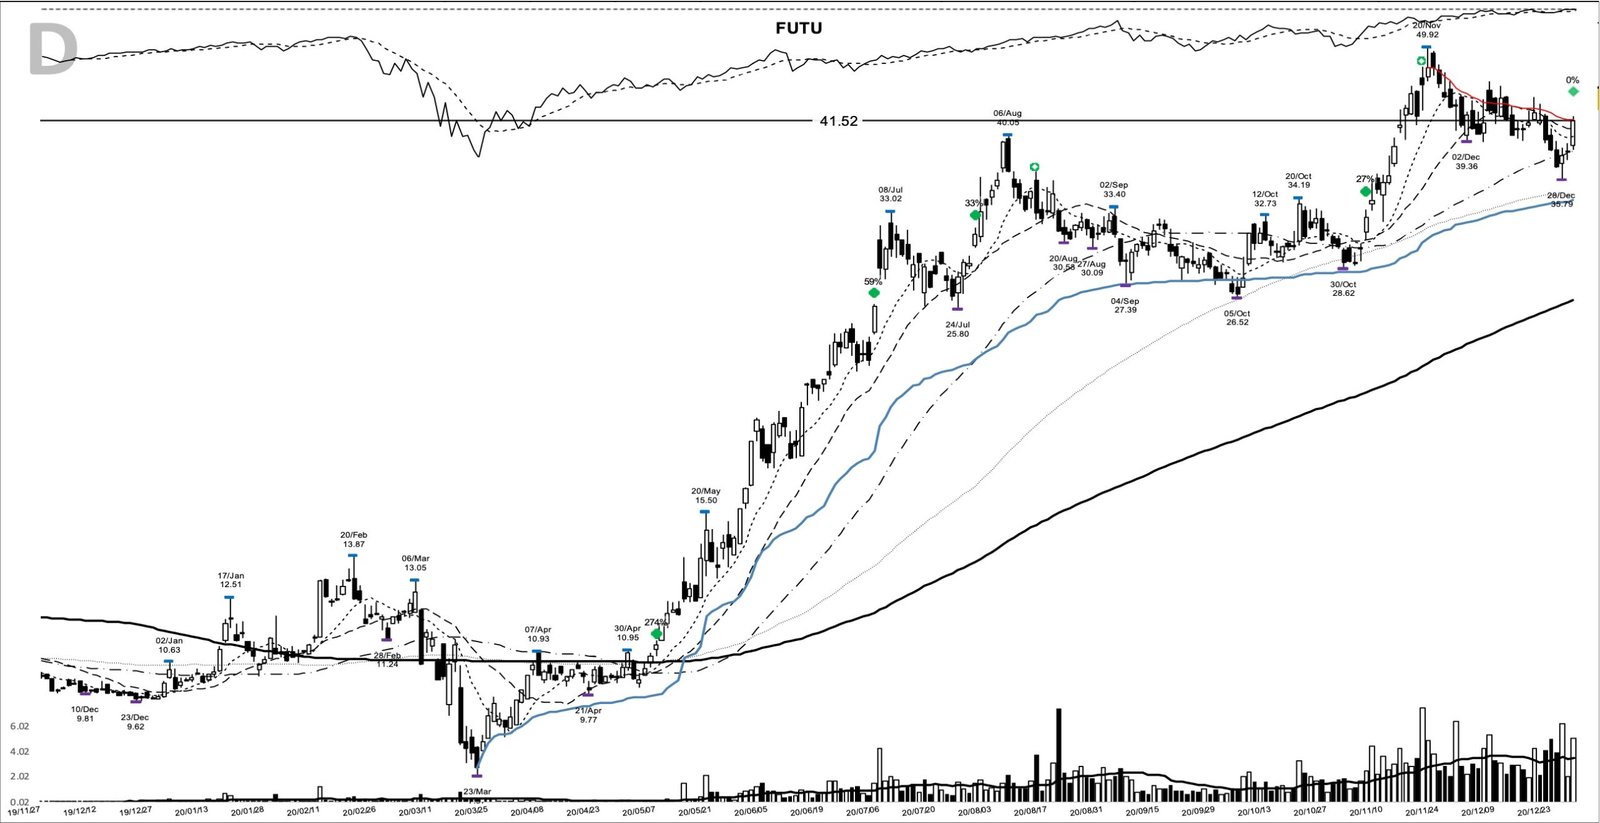
A trader using this pattern might have watched for the trend to keep making higher highs above a rising short-term line, and to keep holding until that structure broke. That is close to what happened. From the 11.11 breakout, FUTU trended for months, and there were opportunities to add as it worked: 2 July 2020 near 26.05 (up about 134% from entry), 29 July near 31.22, 5 November near 32.59, and 30 December near 41.52 (up about 274%). Each add sat on top of an established trend, the textbook use of pyramiding into a position.
The move stretched into a near-vertical final leg. Price peaked at 199.54 on 10 February 2021, then rolled over with the broader growth complex. By the exit at 141.05 on 3 March 2021, it had already given back roughly 29% from that peak. Measured from the breakout close, that is +1,169.8% over about 300 calendar days. On the money, 1,000 dollars riding the full move would have become about 12,698 dollars.
Where traders misread this setup
The first trap is the volume. A trader insisting on a heavy-volume breakout would have skipped FUTU on 7 May, because the 1.2 times average was ordinary. Demanding perfect confirmation can filter out real leaders, and it did here.
The second trap is the depth of the base. A 42.5% drawdown inside the structure means a lot of overhead supply and plenty of room for a shakeout. A dip back under the 9.97 shelf, or worse the 7.97 low, would have stopped a disciplined trader out for a small loss, and that outcome was always on the table. The clean run in hindsight hides how many nearby stops sat under the entry.
The third trap is the ending. That last surge to 199.54 was a climax, far extended above the 10- and 20-day lines. Buying that climax, months after the quiet break, is where trend followers get hurt. One winner also proves nothing on its own; the honest frame is survivorship bias, since the charts that trend for a year are exactly the ones that get saved.
Keep the FUTU chart on your watch list
The lesson is small and repeatable. A stock built a long base, cleared a defined pivot on unremarkable volume, and then rewarded a plan that trailed the trend instead of guessing a top. Nothing about the entry felt dramatic; the discipline was in the holding. Learn the pattern. Ride the trend. Keep the gains.
Related studies: FSLY base breakout, May 2020, NIO base breakout, May 2020, and TSLA base breakout, November 2019. A fresh winner study lands here most evenings.
Price and volume figures are computed from split-adjusted daily OHLCV data; company figures come from SEC filings where cited.
Educational content only. Not investment advice. Trading involves risk. You are responsible for your decisions.
Get the free Market Wisdom e-book
Join Trends and Breakouts — historical winners, breakout studies, and risk lessons. No spam, unsubscribe anytime.