On 6 July 2020, Sunrun closed at 21.34, just above a shelf it’d been coiling under for two weeks. The stock had spent the spring clawing back from a brutal COVID low, and that Monday it cleared the top of its range. What almost nobody watching the close knew was that the next morning it’d gap to an open of 23.95 on merger news, and keep going. This is the RUN base breakout of July 2020: a leader clearing a 20.66 pivot at 21.34, then running 197% over the next 231 calendar days. RUN’s back on traders’ screens again, which is reason enough to pull this chart and walk it bar by bar.
Key takeaways from the RUN trade
- The pattern was a base breakout: a 21.34 close on 6 July 2020 cleared the 20.66 pivot, the 20-day high set on 19 June.
- The move ran 197% from that close to a 63.39 exit on 22 February 2021, held 231 calendar days; the peak was higher still at 100.93 on 12 January 2021, up 373%.
- The breakout bar was quiet. Entry-day volume ran only 1.3 times the 20-day average; the demand came the next session, when 19.8 million shares traded on the Vivint Solar merger.
- Three spots to add showed up as the trend extended: 3 August, 4 August, and 9 September 2020.
- The edge was following the trend with a protective trail and adds, not predicting the news that gapped the stock.
The RUN trade at a glance
| Field | Value |
|---|---|
| Ticker | RUN (Sunrun Inc.) |
| Breakout date | 6 July 2020 |
| Breakout close | 21.34 |
| Volume vs 20-day average | 1.3x |
| Exit date | 22 February 2021 |
| Exit close | 63.39 |
| Gain | +197% |
| Calendar days held | 231 |
| Peak before exit | 100.93 (12 January 2021) |
The breakout bar on the RUN chart
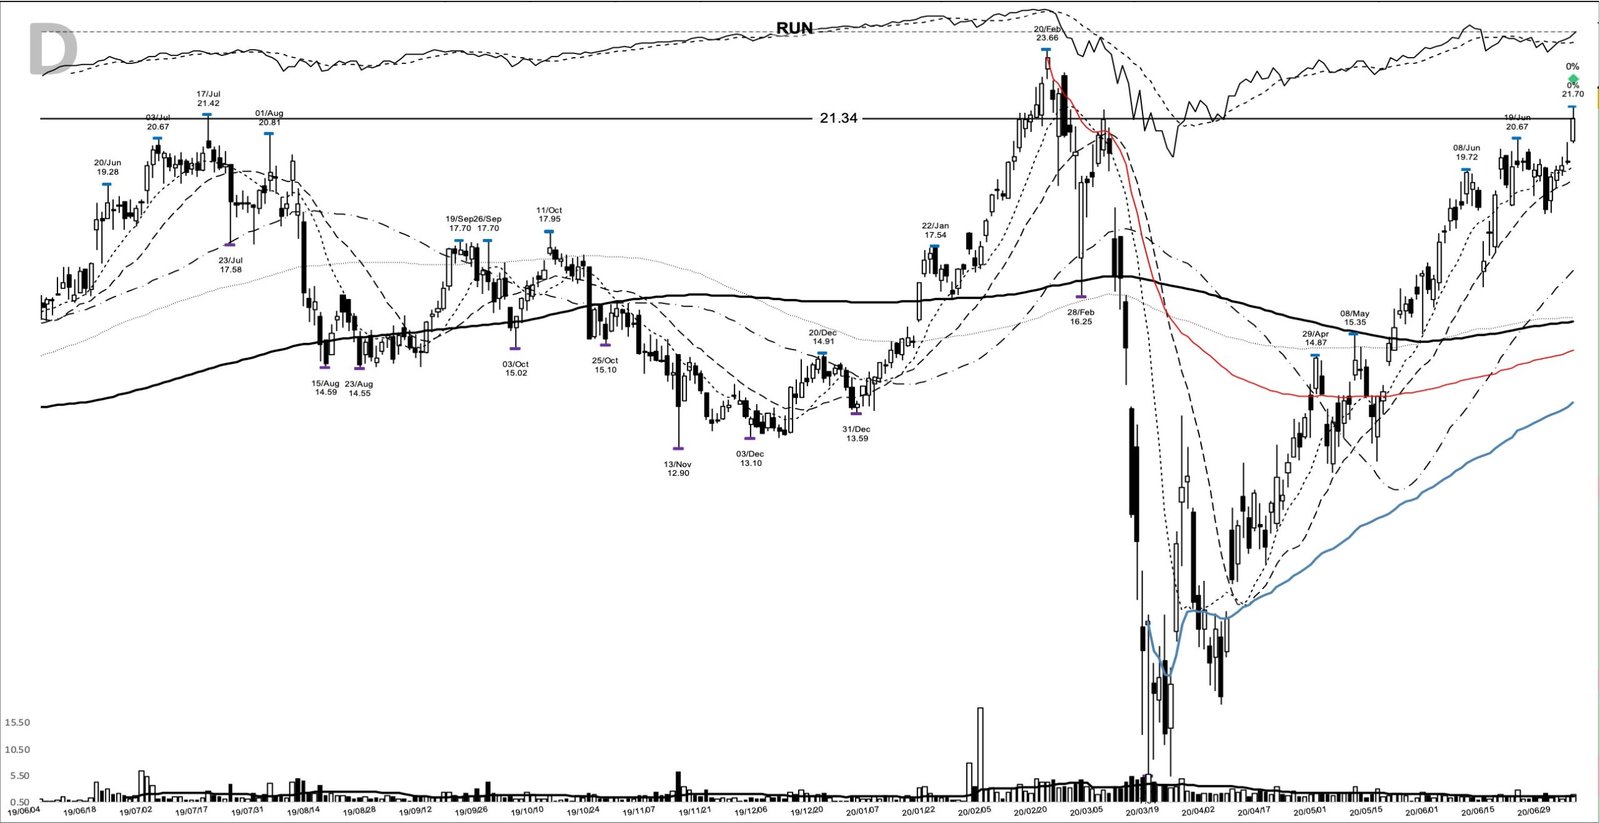
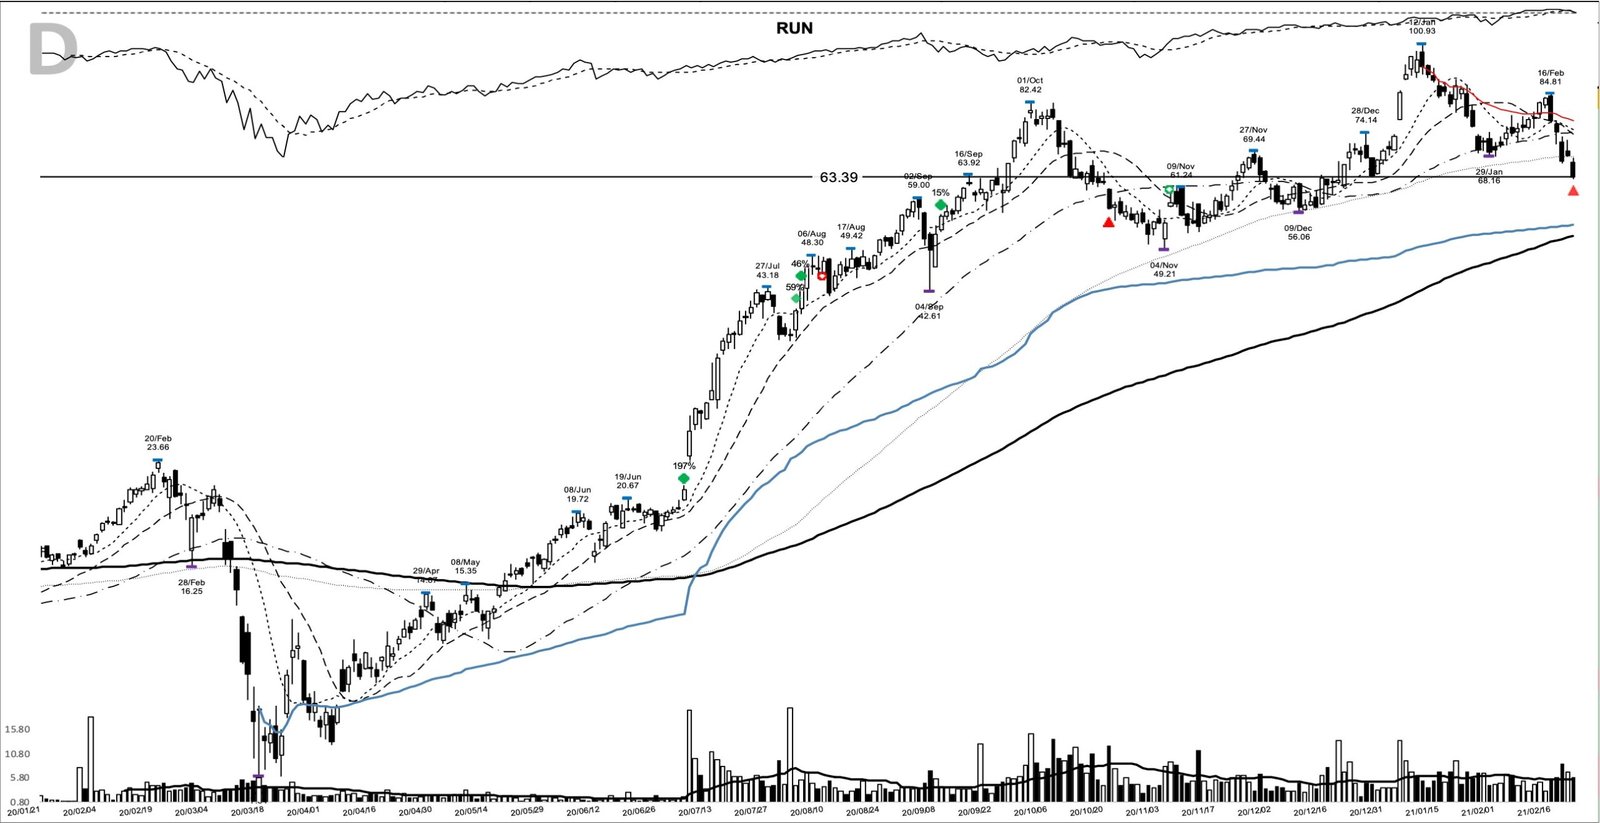
The charts here come from my study archive. Start with the entry-day picture: price pressing against the top of a tight June range, the shorter moving averages stacked underneath, and the 21.34 close finishing above everything on the chart.
Anatomy of the RUN base breakout
The base here was wide and deep. Sunrun topped at 23.66 on 20 February 2020, then the market crash dragged it to 7.83 by 17 March, a 66.9% drawdown. What followed was a three-month recovery that carried price back into the high teens and low twenties by summer.
By late June the action had tightened. The 20-day high sat at 20.66 (the 19 June bar), and the recent shelf low was 18.43 on 26 June. The 21.34 close on 6 July finished above that 20.66 pivot, so this counts as a confirmed breakout: the pivot cleared on the entry day itself, at a 21.34 close.
The volume, though, didn’t shout. Roughly 1.9 million shares changed hands against a 20-day average near 1.5 million, about 1.3 times normal. That’s a quiet breakout bar, and the honest read is that the tape hadn’t yet confirmed demand. Reading volume on this setup meant waiting one more session, where nearly 20 million shares traded and the stock closed at 26.17.
The trend posture was cleaner than the volume. At the entry the 10-, 20-, and 50-day moving averages were stacked at 19.83, 19.45, and 16.92, all below price and rising, and the close had held above its 10-day line for four straight sessions, finishing 7.6% above it. In the top panel the relative strength line had climbed back with price after the March washout. The leadership was real; the fuel, as it turned out, was the story more than the earnings.
Sunrun’s business into the breakout
Sunrun was the largest residential solar installer in the United States, and its numbers into the summer weren’t a growth-acceleration story. Reported EPS had turned positive late in 2019, at 0.23 for the third quarter and 0.10 for the fourth, then the pandemic knocked the first half of 2020 back into losses of 0.23 and 0.11. Quarterly revenue slipped from about 215.5 million in Q3 2019 to 181.3 million in Q2 2020. The chart was leading the fundamentals, not following them.
The catalyst arrived on the entry date. On 6 July 2020 Sunrun agreed to acquire Vivint Solar in an all-stock deal worth roughly 3.2 billion in enterprise value, 0.55 Sunrun shares for each Vivint share, creating the dominant player in US rooftop solar. That’s the news that gapped the stock the next morning and drew the crowd the breakout bar hadn’t.
The tape that rewarded solar in 2020
The backdrop did the trend a favor. The second half of 2020 was a clean-energy rally: the Invesco Solar ETF more than doubled on the year, and Sunrun itself was up more than 300% for 2020 by the autumn. The drivers were election-season hopes for federal renewable support and a wave of ESG money rotating out of fossil fuels.
The broad market helped too. Coming out of the March low, the tape rewarded growth and momentum, and the strongest names kept making new highs while the averages recovered. A breakout like this had wind behind it, which is part of why the follow-through was so violent.
In early July that strength had a lopsided quality: the Nasdaq was running essentially clean of distribution while the broader indexes carried more baggage, and with policy support underwriting the bid, the practical stance was alignment with the trend and honest risk management rather than second-guessing it. A quiet-volume breakout inside that tape deserved a position sized for the doubt.
How a trader could have prepared for the RUN breakout
Everything needed to watchlist this stock was on the chart before the gap. Price had reclaimed the pre-crash structure, the 10-, 20-, and 50-day lines were stacked and rising, the relative strength line was recovering, and the June range was tightening under a clear 20.66 pivot. That’s what puts a name on a list before it moves.
From there the plan writes itself, in the style of a William O’Neil leader breakout. A trigger sits above the 20.66 pivot (the 19 June high). The initial stop goes below the 18.43 shelf (the 26 June low), with the 7.83 base low from 17 March as the deeper line where the whole structure would fail. Once price is moving, the exit becomes a trail: follow the 10-day line near 19.83, widening to the 20-day near 19.45 once the position is well advanced. Note the risk one more time before sizing: at 21.34 the stock was still 9.8% below its 23.66 prior high, so overhead supply was a real consideration.
How the RUN trade played out
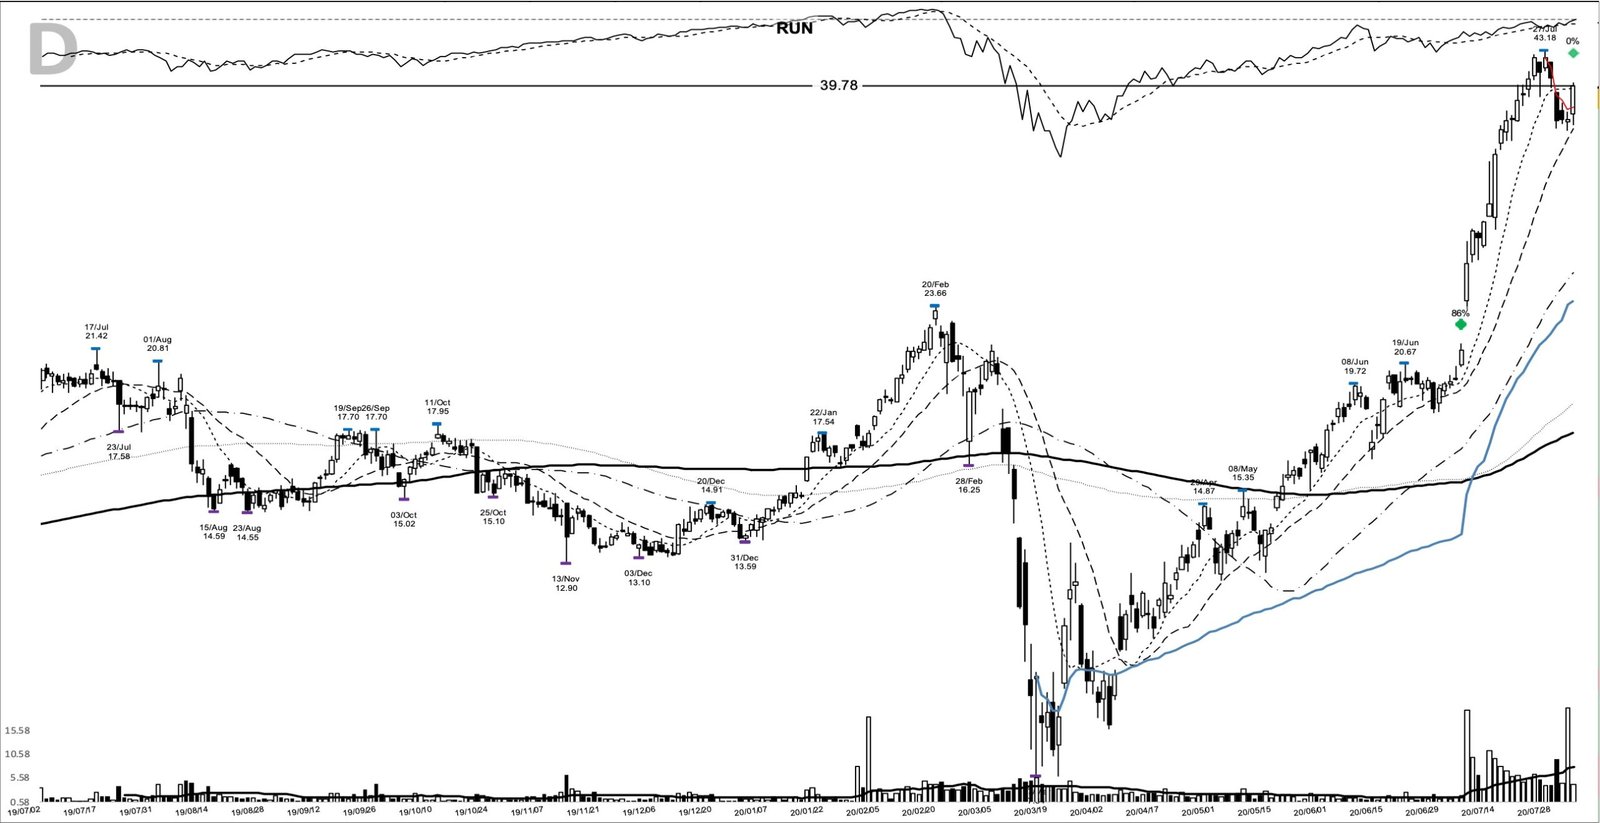
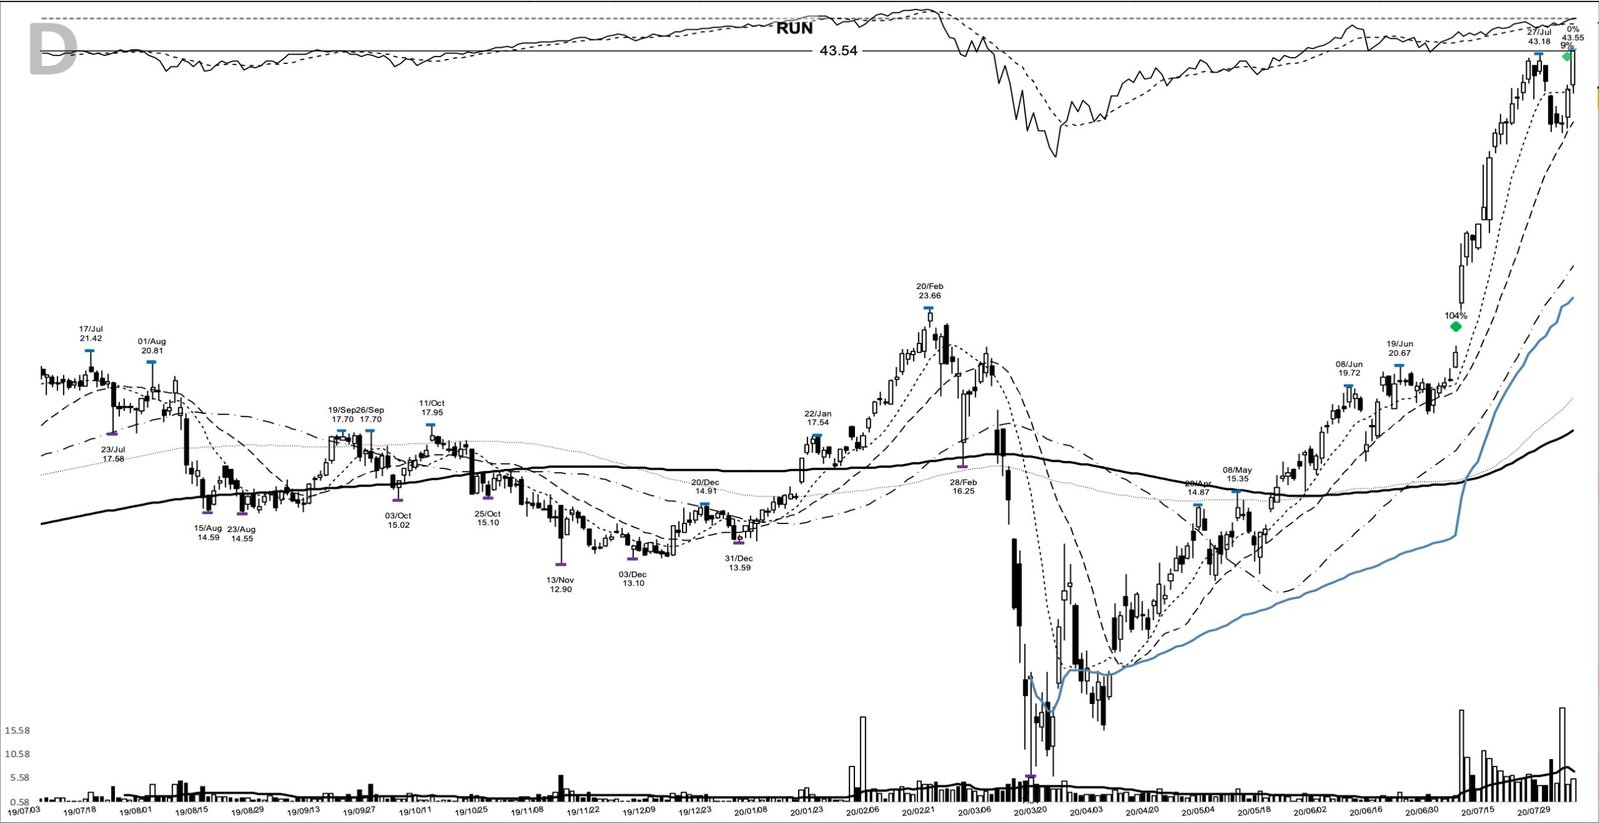
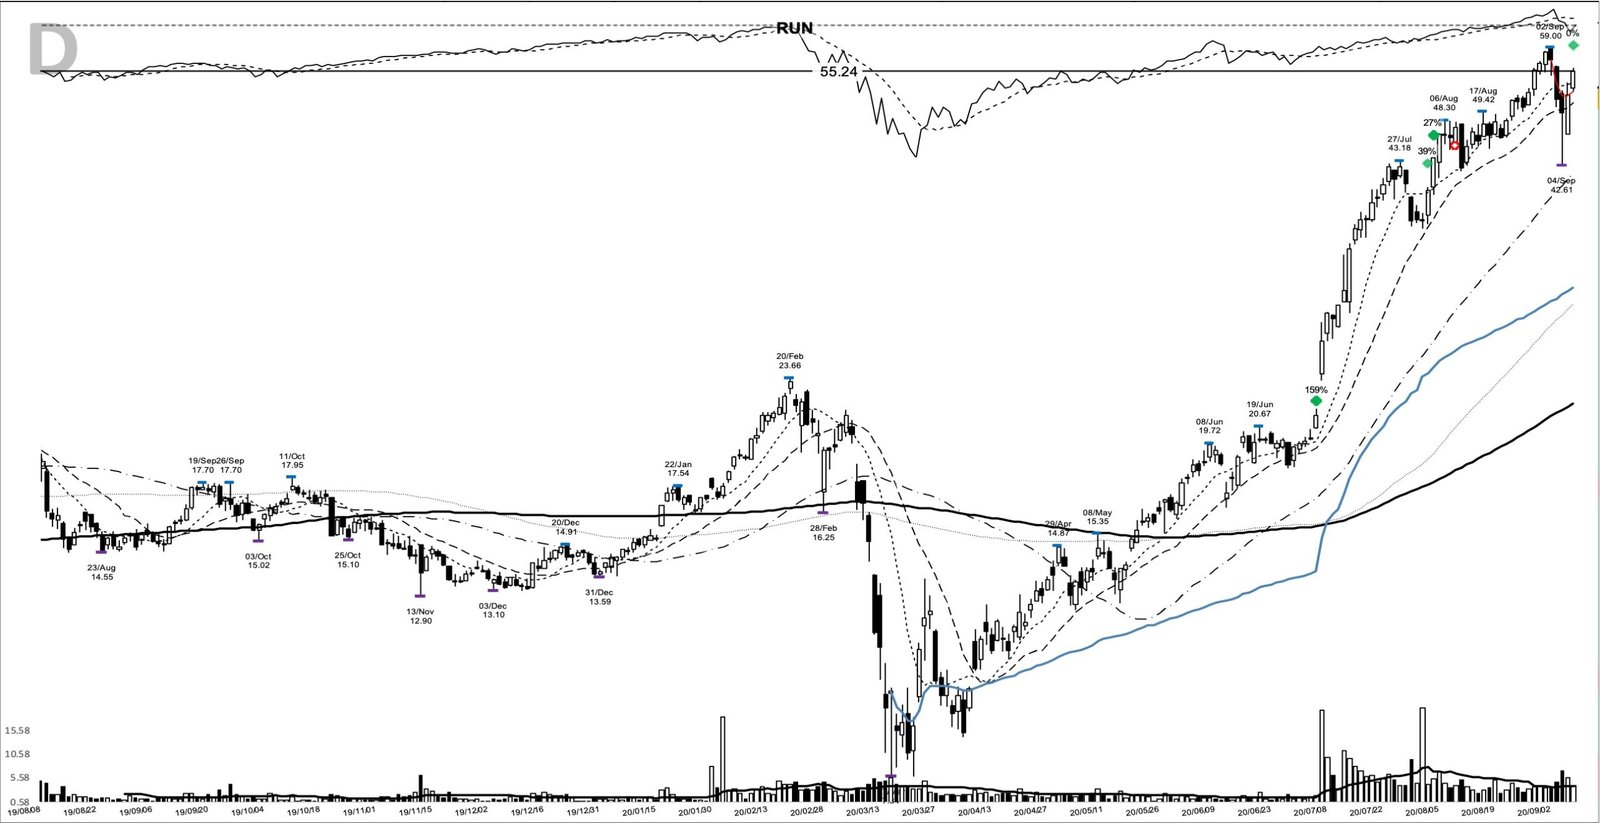
The next session, 7 July, opened at 23.95 and closed at 26.17 on nearly 20 million shares, the volume the breakout bar lacked. From there the trend did the work. There were three spots to add as it extended: 3 August near 39.78, 4 August near 43.54, and 9 September near 55.24. Pyramiding into a position like this only works because the initial entry’s already deep in profit, so each add rides on a cushion rather than fresh risk.
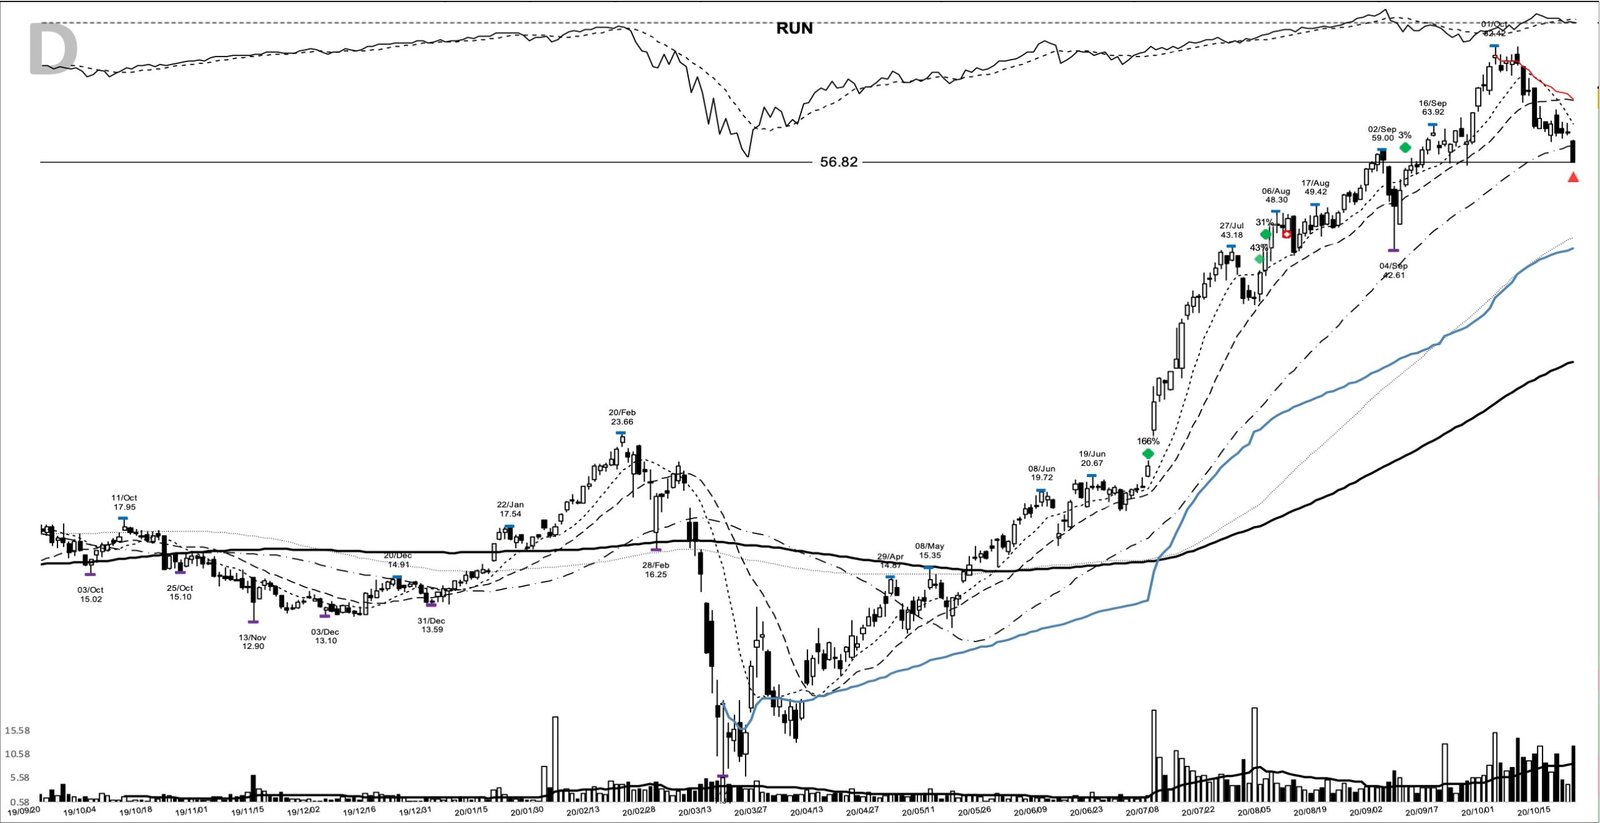
The chart marks a sell point on 21 October at 56.82, and the run kept climbing after it into the new year. Price peaked at 100.93 on 12 January 2021, up 373% from the entry, then rolled over. The marked exit closed the move at 63.39 on 22 February 2021, up 197% from the 21.34 entry. On the numbers, 1,000 dollars held through the full move would’ve become about 2,970 dollars.
That February exit printed into the roughest week growth stocks had seen since the prior autumn: a sharp shakeout, wide and sloppy trading, and a rebound nobody yet trusted. The names that had run furthest were the first to be graded, and a solar leader well off its January peak graded itself. Taking the exit there kept a big study gain from becoming a round trip.
Where the RUN breakout could have fooled you
The quiet volume was the first trap. A 1.3 times bar falls short of demand-confirmation; the crowd that made this trade work showed up the next session on merger news no chart could’ve front-run. Buying the breakout bar alone, without a plan and a stop, would’ve been guessing that the next candle went the right way.
The base itself carried a warning. A 66.9% drawdown recovery off a crash is a lower-quality structure than a tight flat base, and the 23.66 prior high stood as overhead the stock had to punch through. Plenty of V-shaped recoveries stall right there; this one happened not to.
The peak was the last illusion. The move topped at 100.93, up 373%, well above the 63.39 exit at 197%. No method sells the exact top, and a trailing approach gives back a slice from the high by design. Chasing the extended January spike near 100 would’ve been buying straight into that top rather than the base.
What the RUN chart leaves you with
The lesson’s simple, and it repeats. A real pivot cleared, adds as the trend proved itself, and a trail rather than a target to decide the end. The merger was a gift, not a forecast, and the money was in the trend following discipline that stayed with the move for 231 days. Learn the pattern. Ride the trend. Keep the gains.
Related studies from the same era and pattern: the NIO base breakout of May 2020, the RIOT base breakout of May 2020, and the MARA base breakout of October 2020. A new winner study lands most evenings.
Price and volume figures are computed from split-adjusted daily OHLCV data; company figures come from SEC filings where cited.
Educational content only. Not investment advice. Trading involves risk. You are responsible for your decisions.
Get the free Market Wisdom e-book
Join Trends and Breakouts — historical winners, breakout studies, and risk lessons. No spam, unsubscribe anytime.