In the first week of April 2020, NVAX printed the kind of quiet breakout most traders scroll past. The stock cleared a 14.93 pivot and closed the session at 15.61, with volume running only 1.1 times its 20-day average, hardly the thunderclap the textbooks promise.
Novavax is back on traders’ screens this week, sitting around fifth on StockTwits as the company heads toward second-quarter 2026 results it’s scheduled for 6 August. That makes the NVAX base breakout of 2020 worth pulling from the archive. What followed the April entry is the reason to study it: a move of 1,458% over 326 calendar days, with several chances to add along the way, before the exit closed at 243.23.
Key takeaways from the NVAX breakout
- The pattern was a base breakout. Price cleared a 14.93 pivot and closed at 15.61 on 3 April 2020, on volume just 1.1 times the 20-day average.
- From that breakout close, the move ran 1,458% over 326 calendar days to a 243.23 exit on 23 February 2021.
- The advance came in stages, with add points on 11 May, 15 June 2020 and 29 January 2021 as the trend extended.
- The stock peaked at 331.68 on 9 February 2021, roughly two weeks before the exit.
- The repeatable edge was trend-following: trailing a rising moving average and letting the stop decide the exit.
The NVAX trade at a glance
| Metric | Value |
|---|---|
| Ticker | NVAX |
| Breakout date | 3 April 2020 |
| Breakout close (entry reference) | 15.61 |
| Volume vs 20-day average | 1.1x |
| Exit date | 23 February 2021 |
| Exit close | 243.23 |
| Gain | 1,458.2% |
| Calendar days held | 326 |
| Peak before exit | 331.68 (9 February 2021) |
The chart NVAX printed into April 2020
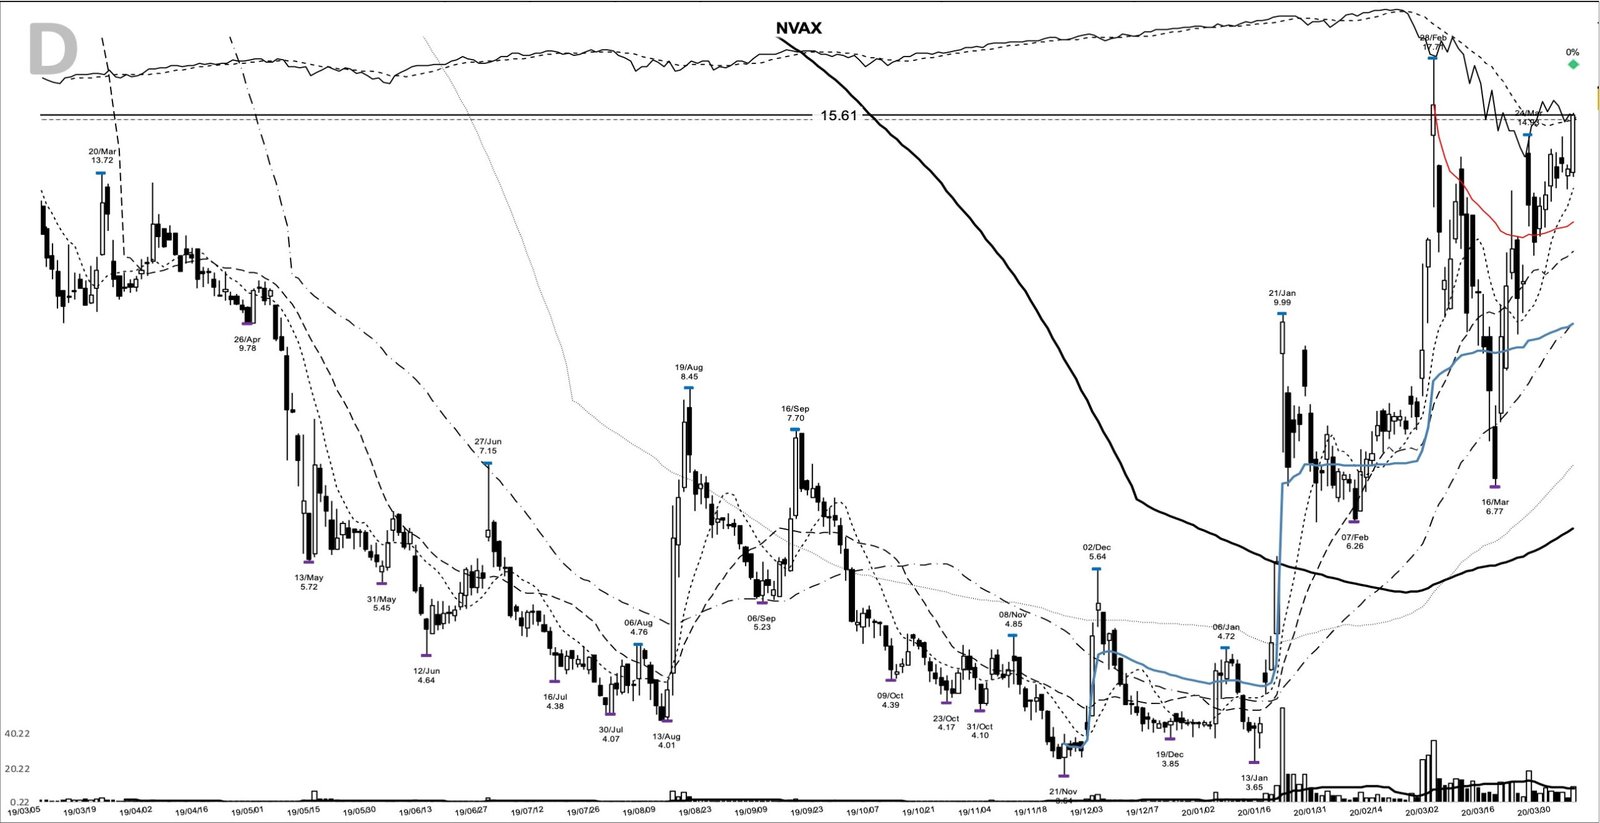
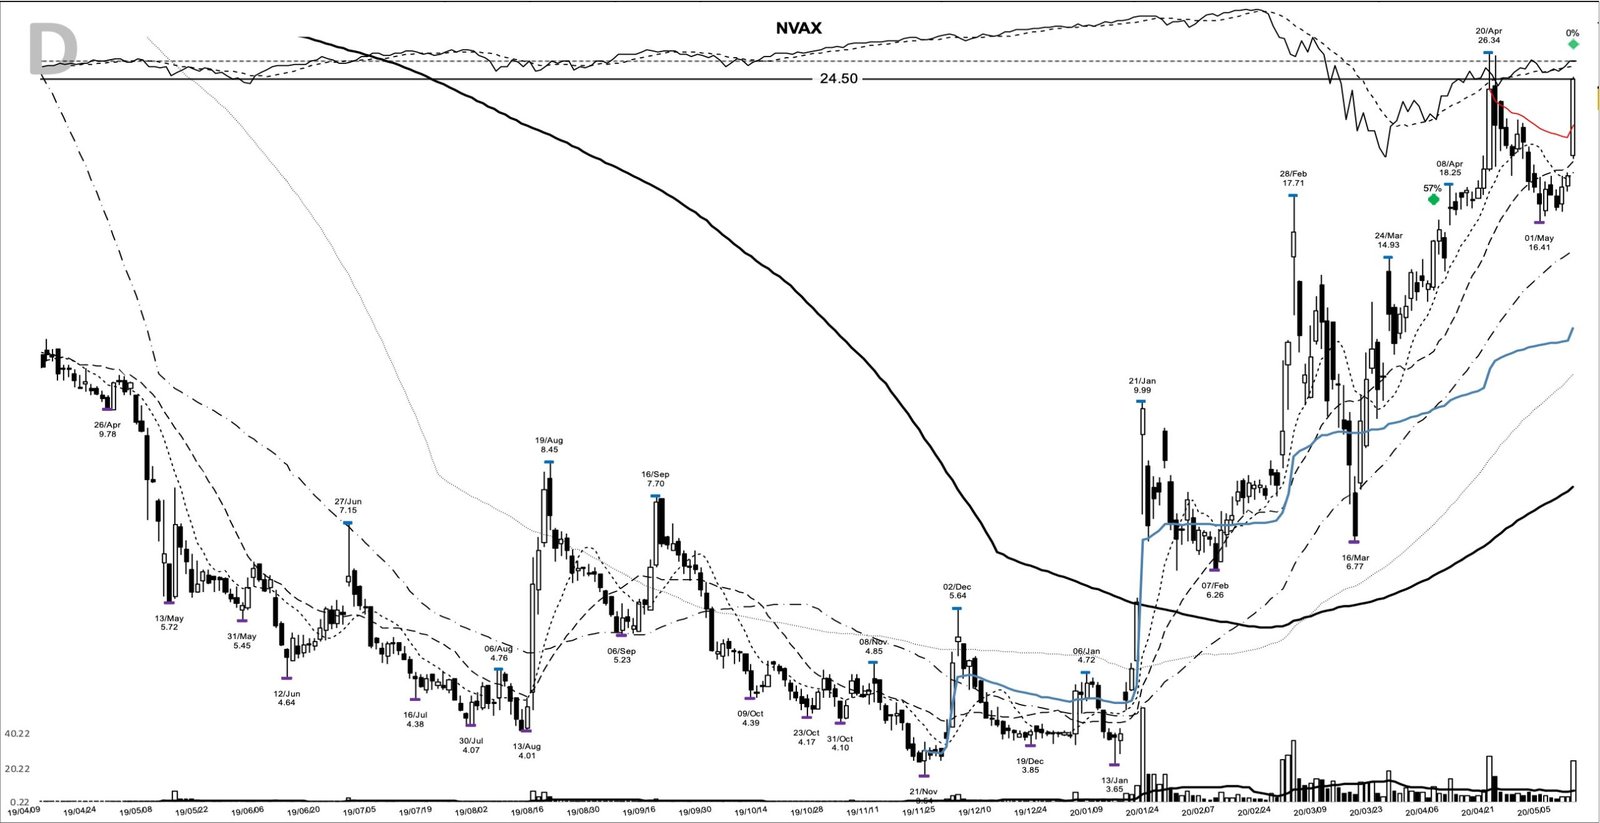
The charts below come from my study archive, and this first one frames the setup. Through most of 2019, NVAX bled lower, sliding from the mid-teens to a base low of 3.54 on 21 November 2019. A sharp recovery carried it to 17.71 by 28 February 2020, and then the February to March crash dragged it back to 6.77 on 16 March. That’s the base the April breakout would clear.
By early April the stock had climbed back to its 14.93 pivot, and the 3 April bar closed at 15.61, drawn on the chart as the horizontal line. Short-term moving averages had turned up under price, and the relative strength line at the top of the panel was riding near its highs while the broad market was still repairing itself. It’s a chart already pulling ahead of the tape.
Anatomy of the NVAX base breakout
The base ran deep and long. From the 17.71 high on 28 February 2020 back to the 3.54 low the prior November, the structure spanned roughly six months and about 80% of the stock’s price, a wide and volatile base, and it’s a long way from a thin, tidy cup. Inside it, the base breakout trigger was clean: a 14.93 pivot set on 24 March 2020, with a shelf low of 12.15 on 27 March marking where the last shakeout ended.
On 3 April the stock pushed through the pivot and closed at 15.61, the entry the chart marks. The detail worth sitting with is volume. At 1.1 times the 20-day average, the breakout bar carried no real expansion. If volume was your only green light, you’d have stayed out; the trend, not the breakout-day tape, did the heavy lifting here. Novavax didn’t have earnings to lean on, only a fast-moving vaccine story, so the setup was a technical case first and a fundamental bet second.
What Novavax was doing in the spring of 2020
The business behind the chart was a clinical-stage biotech with a single, enormous question hanging over it: could its protein-based candidate, NVX-CoV2373, become a COVID-19 vaccine? In March 2020 the Coalition for Epidemic Preparedness Innovations, CEPI, put up early seed funding, and by April the company was reporting encouraging preclinical immune-response data. There weren’t revenues or earnings to model, so the market was pricing a probability, with no P/E to anchor it.
On 11 May 2020, CEPI committed up to $388 million to the program, and the chart answered immediately. The 11 May bar closed at 24.5 on volume of 24.6 million shares, nearly three times the breakout day’s turnover, and about 57% above the April entry. That’s the volume expansion the breakout itself never delivered. The government’s Operation Warp Speed followed on 7 July 2020 with $1.6 billion, and now the vaccine trade’s got its fundamental engine.
The market NVAX broke out into
Context matters, and the backdrop in early April 2020 was unusual. The broad market had just bottomed in the last week of March after the fastest crash in decades, and money was rotating hard into anything tied to a pandemic solution. Breakouts were working again after weeks of forced selling, and a vaccine name with a live catalyst sat in the sweet spot of what the tape wanted to own. When a trend starts as the general market turns up, the wind’s at its back, and this one had it.
It is worth saying plainly how early this was. In the first week of April the market still classed as a deep correction, and the disciplined crowd sat largely in cash, building watchlists and wary of speculative bottom picks off short bases. An entry here leaned on theme strength and relative strength against that caution, and it only made sense with the failure level defined before the fill.
Building the watchlist case before the breakout
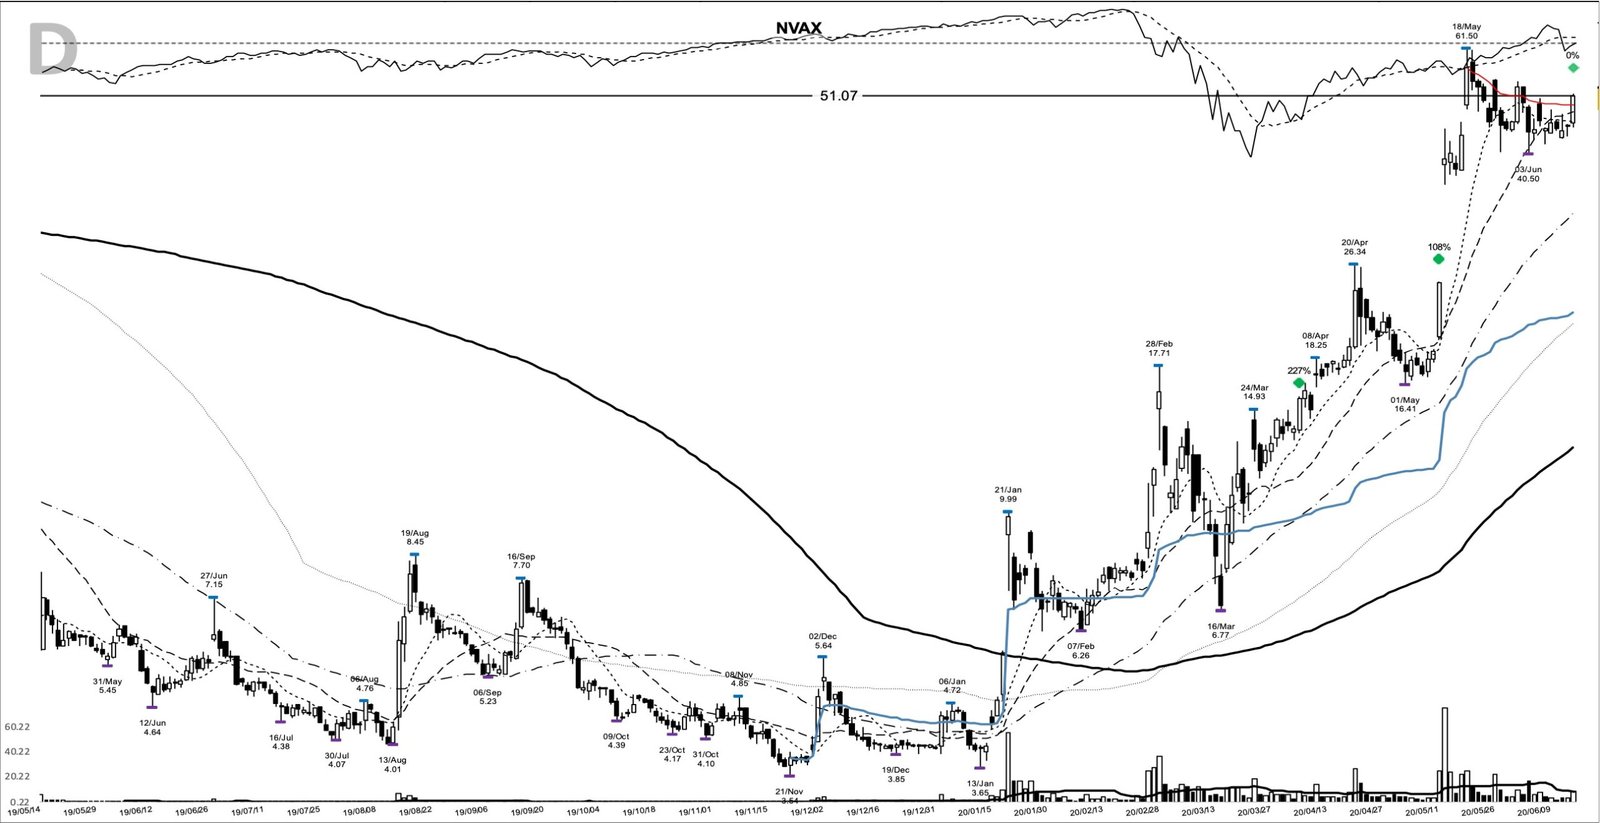
Could a trader have seen this coming? The structure gave several tells before 3 April. Price had closed above its 10-day moving average for 13 straight sessions into the pivot, and at the entry it sat 17.9% above that line, with the 10-day (13.24), 20-day (11.52) and 50-day (9.81) averages stacked in rising order. That’s a stock already in gear.
The same posture repeated on the way up. By 15 June 2020 the stock closed at 51.07, still riding its rising averages, more than 227% above the April entry, and there’s another spot to add for anyone following the trend.
On a watchlist, the case wrote itself: a stock reclaiming a multi-month base, a clear pivot at 14.93 from 24 March, and a shelf low at 12.15 from 27 March that defined the risk. A trend follower could have sketched the plan that morning. Enter on strength above the 14.93 pivot. Set the initial stop below the 12.15 shelf, with the 3.54 base low as the level where the whole structure fails. Then trail a rising 10-day moving average, widening to the 20-day once the move is well advanced, and let the trailing stop decide the exit.
How the NVAX trend played out
A trader using this pattern would’ve spent the next ten months on one question: is the trend still intact? For a long stretch the answer was yes, though never calmly.
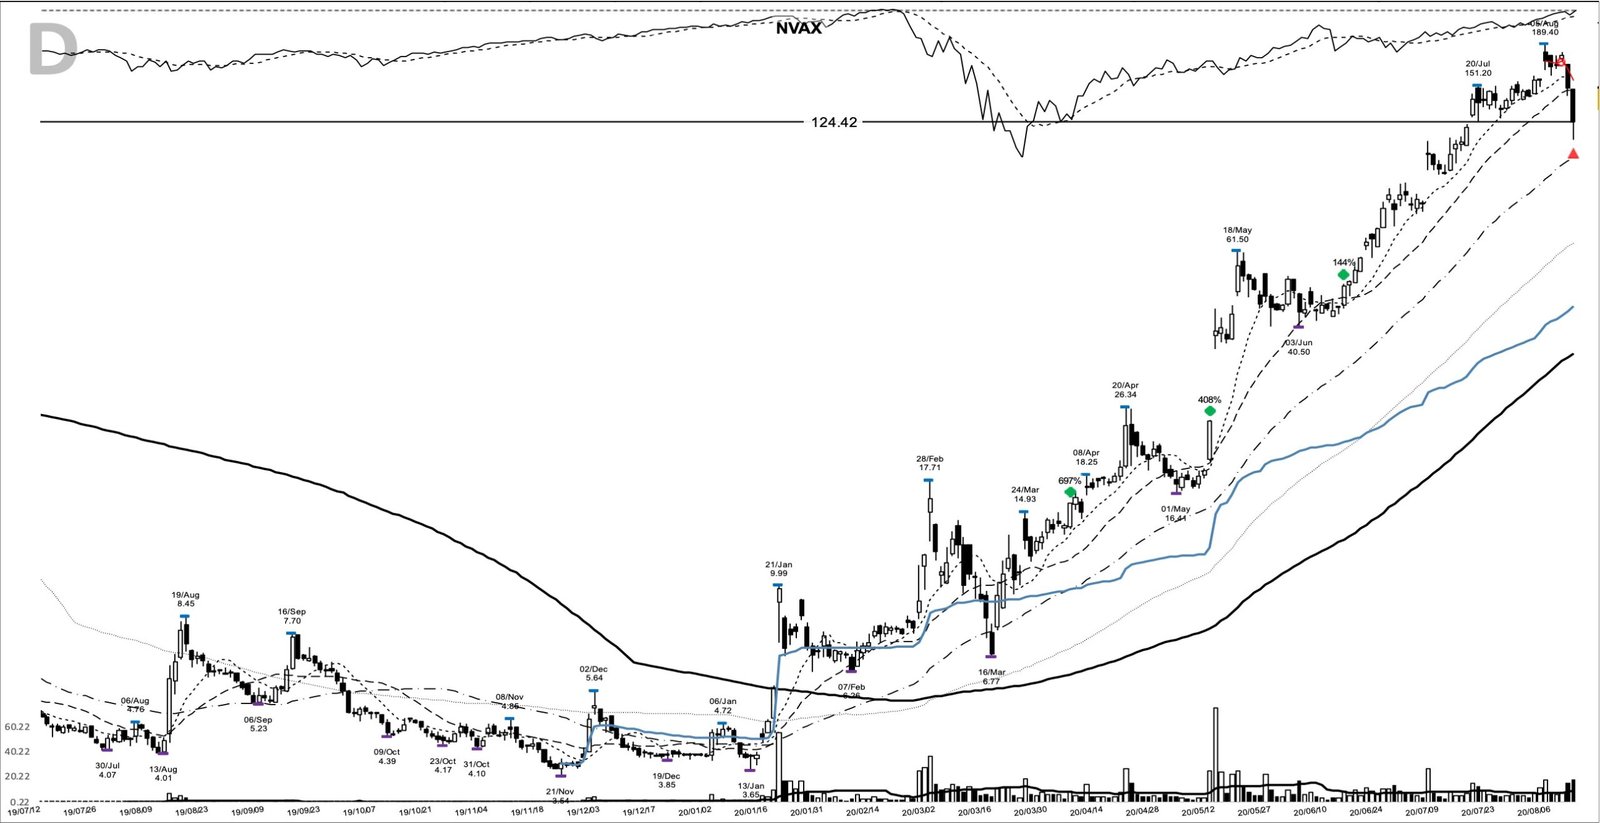
By 12 August 2020 the stock closed at 124.42, nearly 700% above the April entry, but the bar tells you how wild the ride was. It printed a high of 148.5 and a low of 112.51, a swing of more than 30% inside a single session. That’s the kind of range where a mechanical trail earns its keep, flagging a spot to reduce without calling the top.
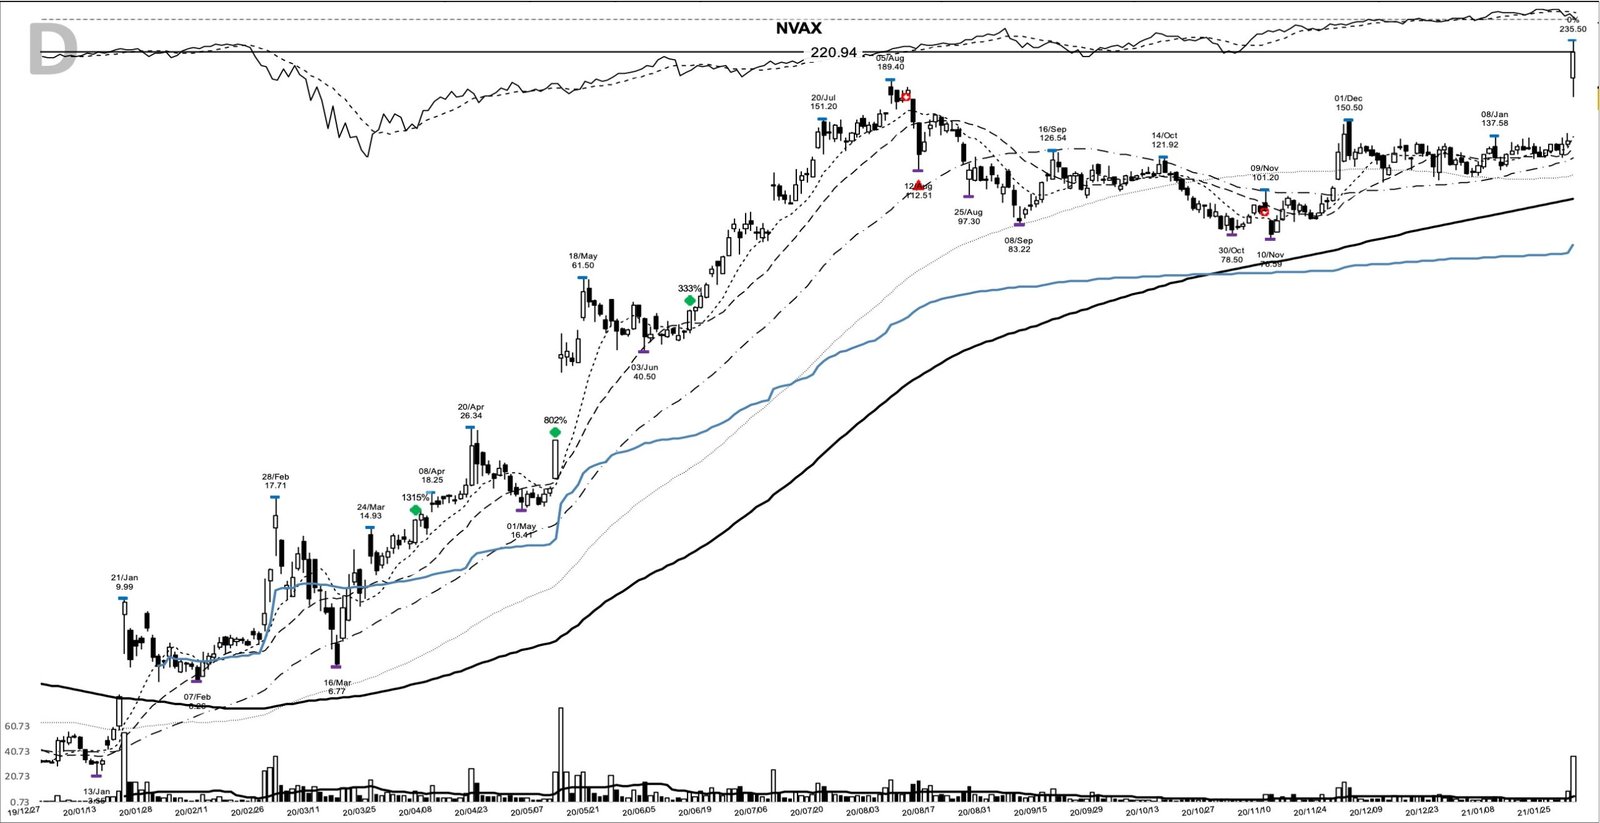
The bigger move was still ahead. On 28 January 2021, Novavax reported 89.3% efficacy from its Phase 3 UK trial, and the stock gapped again. The 29 January bar closed at 220.94, more than 1,300% above the April entry, and the chart marks it as one more add point in a trend that wouldn’t quit.
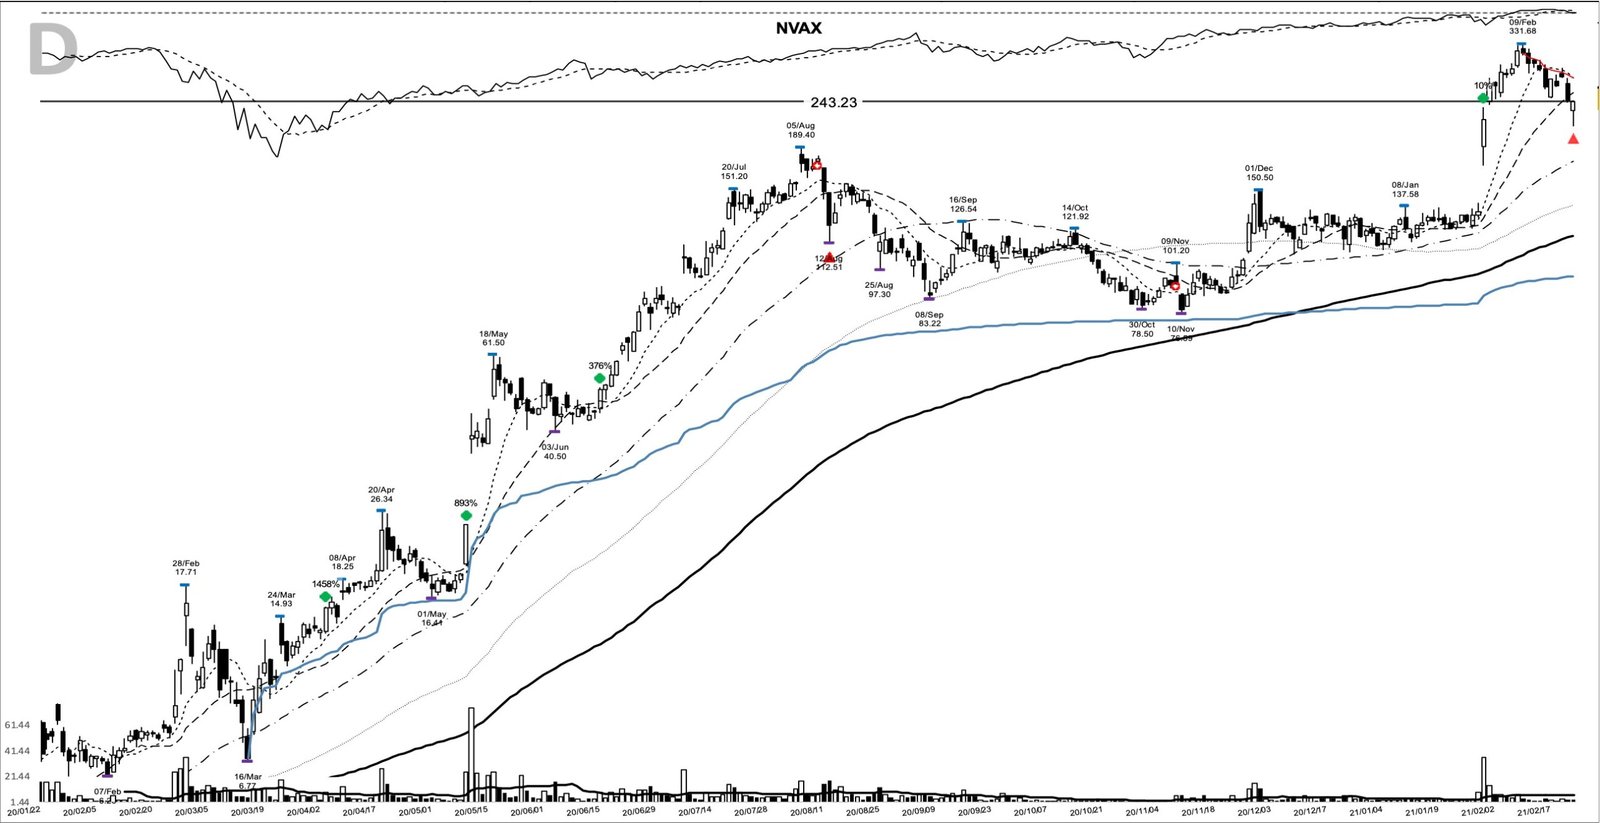
Price peaked at 331.68 on 9 February 2021, then rolled over. Two weeks later, the exit closed the move at 243.23 on 23 February, 1,458% above the breakout close and 326 calendar days after it began. A thousand dollars committed at that 15.61 breakout close and held through the whole trend would’ve become about $15,582 by the exit.
Late February 2021 was rough company for extended growth charts. A violent shakeout had just ripped through the complex, the rebound was loose and unproven, and the standing advice was to grade holdings and drop the weakest before weakness spread. A vaccine name up more than a thousand percent, two weeks past its peak, was precisely the kind of holding that discipline pointed at.
Where traders misread a setup like this
Three misreads sink traders on charts like this. The first is demanding a volume surge on the breakout bar. This one broke out on 1.1 times average volume and still ran 1,458%; if volume expansion is your only green light, you’re left watching.
The second is chasing the obvious spike. Buying the 11 May funding gap after a 57% run, or the 12 August range after nearly 700%, put you in front of the next sharp pullback, and there’s no defined risk in either one. The pattern promised a trend to follow, never a straight line to ride.
The third is confusing one winner with the base rate. For every NVAX that runs 1,458%, plenty of clean-looking breakouts fail right at the pivot, and that’s exactly why the stop below the 12.15 shelf matters more than the entry itself.
Learn the base, then let the trend decide
What NVAX teaches is a method. A base breakout gave a low-risk entry with clear invalidation at the 12.15 shelf, and trend-following discipline, a stop trailing a rising average, turned a 15.61 breakout close into a 326-day move. The stage-two advance did the work, and the harder skill was staying out of its way through every shakeout. When NVAX shows up on your screen again, it’s the chart worth studying. Learn the pattern. Ride the trend. Keep the gains.
Related reading on base breakouts
No prior NVAX study sits in the archive yet, so start with the method behind the setup. William O’Neil built a career on base breakouts in market leaders, and the CANSLIM system lays out the base-and-pivot logic in full. For the holding side, trend-following covers the trailing-stop discipline that carried this trade. There’s a new winner study here most evenings.
Price and volume figures are computed from split-adjusted daily OHLCV data; company figures come from SEC filings where cited.
Educational content only. Not investment advice. Trading involves risk. You are responsible for your decisions.
Get the free Market Wisdom e-book
Join Trends and Breakouts — historical winners, breakout studies, and risk lessons. No spam, unsubscribe anytime.