When CAR turns up on traders’ screens again, like this week’s return to the StockTwits trending list, the chart worth studying is the CAR base breakout from February 2021. Avis Budget Group had spent six months carving a base out of the pandemic crash, and on 19 February 2021 the stock surged toward its 49.94 pivot on volume 1.8 times its 20-day average, closing at 48.75 just beneath it.
From that entry close of 48.75, the move ran 419.5% over 285 calendar days to the exit on 1 December 2021, with a vertical spike to a peak of 545.11 near the end. The setup that started it was ordinary enough to spot in advance, which is the whole reason it’s worth walking through.
Key takeaways from the CAR base breakout
- A roughly six-month base with a 49.94 pivot drew an entry on 19 February 2021 at a 48.75 close, below the pivot, on volume 1.8 times the 20-day average, with the pivot cleared the next session at a 50.5 close.
- The move gained 419.5% over 285 calendar days, from the 48.75 entry close to the 253.27 exit on 1 December 2021.
- Price ran to a peak of 545.11 on 2 November 2021 in a short squeeze, then gave a large part of it back into the exit.
- The advancing trend kept offering lower-risk continuation points, marked at 69.00, 86.21 and 108.13 as it climbed.
- It’s a trend-following lesson first: the initial risk was small, the run was long, and the stop and the trailing plan carried the trade.
The CAR trade at a glance
| Field | Value |
|---|---|
| Ticker | CAR |
| Study entry date (anticipatory) | 19 February 2021 |
| Entry close | 48.75 |
| Pivot | 49.94 |
| Pivot cleared | 22 February 2021 at a close of 50.5 |
| Volume vs 20-day average | 1.8x |
| Exit date | 1 December 2021 |
| Exit close | 253.27 |
| Gain | +419.5% |
| Calendar days held | 285 |
| Peak before exit | 545.11 (2 November 2021) |
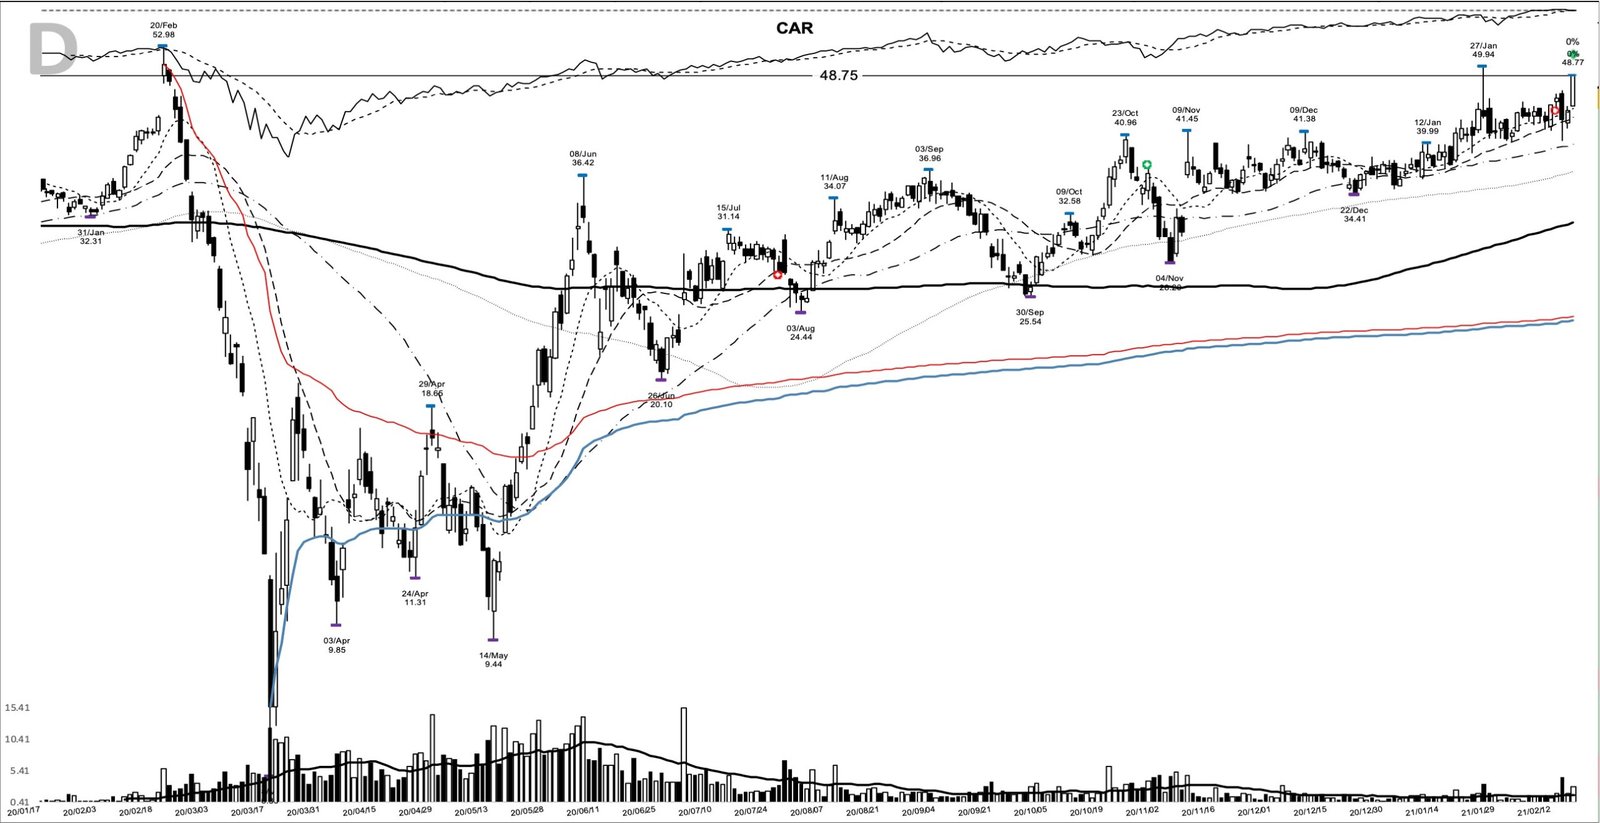
The entry close of 48.75 is the reference every return below is measured from, so that’s the number I anchor the study to. The charts here come from my study archive, marked at each buy and sell point on the daily timeframe.
How the base and breakout formed
The base ran about six months. Price bottomed at 25.54 on 30 September 2020 and rebuilt toward a 49.94 high on 27 January 2021, a deep base measuring roughly 48.9% from high to low. That’s the first thing to respect here: this was ground carved out of the 2020 crash, a far cry from a tidy three-week shelf.
Into 19 February the action tightened. The prior five sessions bottomed at 40.25 on 17 February, forming a shelf under the 49.94 pivot. Then 19 February gapped up from a 44.56 open and closed at 48.75, its 48.77 high stopping just under the pivot, on volume that ran 1.8 times the 20-day average. The decisive push through the 49.94 resistance came the next session, the 50.50 close on 22 February you’d wait for before calling the pivot cleared. That makes the 19 February close an anticipatory entry. It preceded the pivot clearance, which arrived on 22 February 2021 at a 50.5 close.
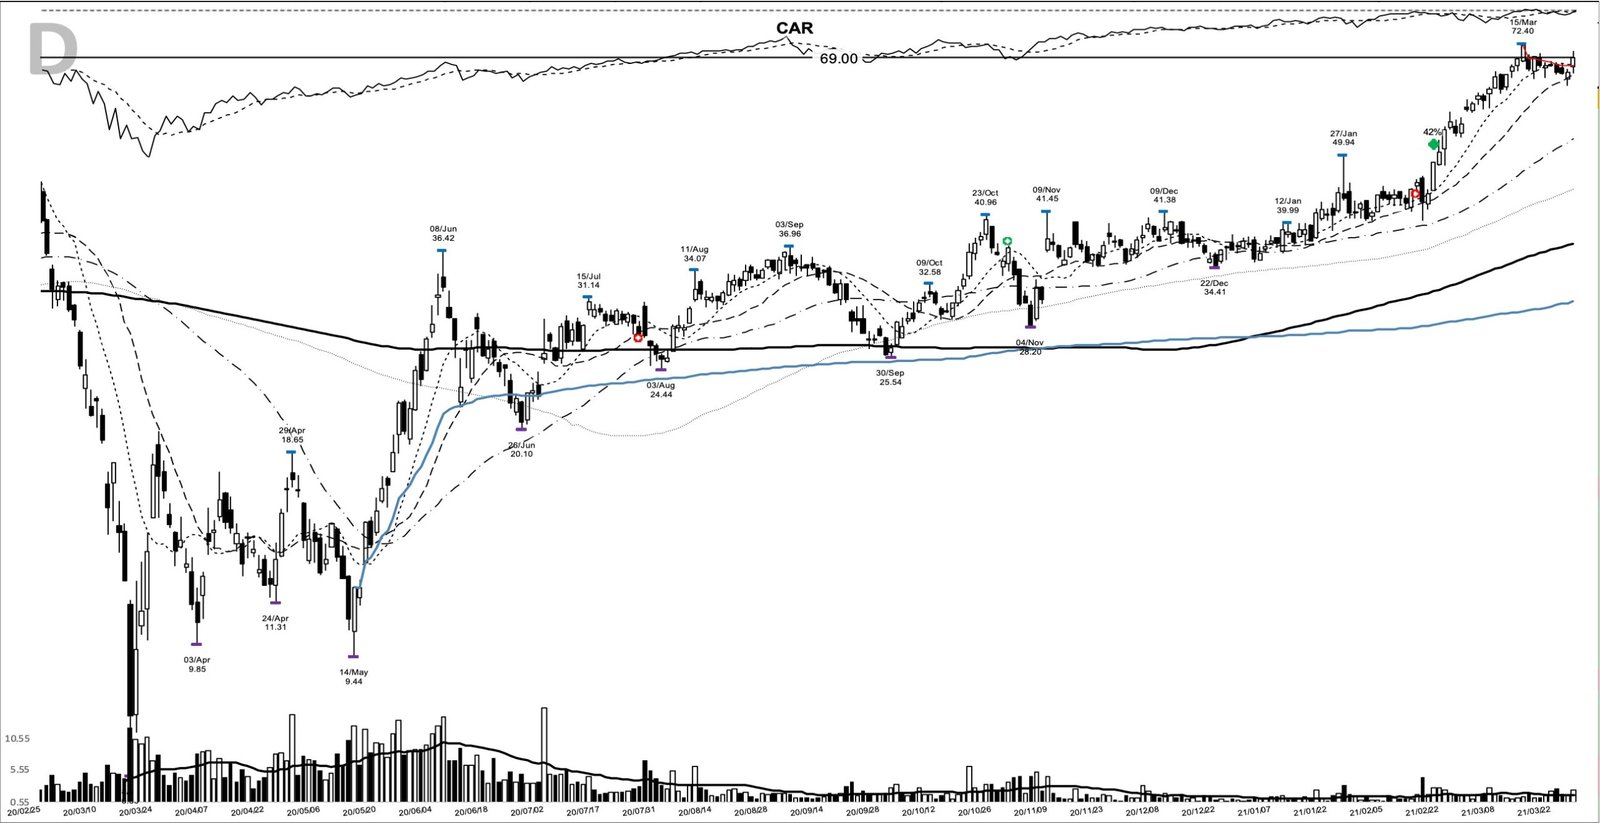
The model-book frame matters as much as the candles. This was a leader with a clean pivot, a rising base of moving averages beneath it, and a business turning up hard off a historic low. In the manner William O’Neil catalogued, that’s the combination that separates a breakout that runs from one that stalls at the pivot.
Avis Budget in early 2021: a rental business clawing back
The fundamentals told a recovery story. The last quarter reported before the breakout, for the period ending 30 September 2020, showed earnings per share back to a positive 0.63 after a 6.91 loss the quarter before. Revenue for that same September quarter was 1.534 billion dollars, still down 44.3% from a year earlier but up sharply from the 760 million dollar trough three months prior. That’s a business turning up, quarter on quarter.
The story around the tape lined up with the numbers. Travel demand was reviving as vaccinations rolled out, and a used-car price spike driven by the chip shortage lifted the value of every car on the rental fleet. The bankruptcy of Hertz had left Avis as the last listed rental name standing, which concentrated attention on it. None of that guaranteed the breakout, but it’s plain why buyers kept showing up.
The market backdrop into the breakout
The wider tape was working in the trade’s favour. Early 2021 was a reflation and reopening rally, with leadership rotating hard into travel, industrials and other beaten-down cyclicals. A rising tide of that kind rewards fresh breakouts and punishes shorting strength. It’s the environment where a name like CAR can extend for months at a time. Reading that regime is part of the setup, not a footnote to it.
There was froth in that tape too, and it was visible at the time: relentless dip-buying, extraordinary options activity, open talk of bubbles. The posture that worked was riding the evidence while defining the risk, which is exactly what an entry above a clear pivot with a stop under the 40.25 shelf does.
How you could have prepared for the CAR breakout
The posture into 19 February was a textbook stage-two stance. Price sat about 10.2% above its 10-day line at 44.25, with the 10-day, the 20-day at 43.14 and the 50-day at 39.89 all stacked and rising, so you’re looking at trend support layered right under the entry. The stock had reclaimed its pre-pandemic zone, closing roughly 8% under the 52.98 high from February 2020, having travelled all the way up from the 6.35 crash low.
The watchlist trigger was the shelf itself. A tightening range under a clear 49.94 pivot, with a rising 50-day line beneath it, is exactly the kind of structure you’d want on a list before it moves. You’ll see the alert in the range coiling, the confirmation in the volume expansion on the entry session.
From there the plan writes itself for a trend follower: a buy trigger just above the 49.94 pivot, an initial stop below the 40.25 shelf low, with the 25.54 base low the level where the whole structure would’ve failed. After that, you’d trail the 10-day moving average and widen out to the 20-day once the move was well advanced. That’s a small, defined risk against an open-ended reward, which is the only maths trend following needs.
How the CAR trade played out
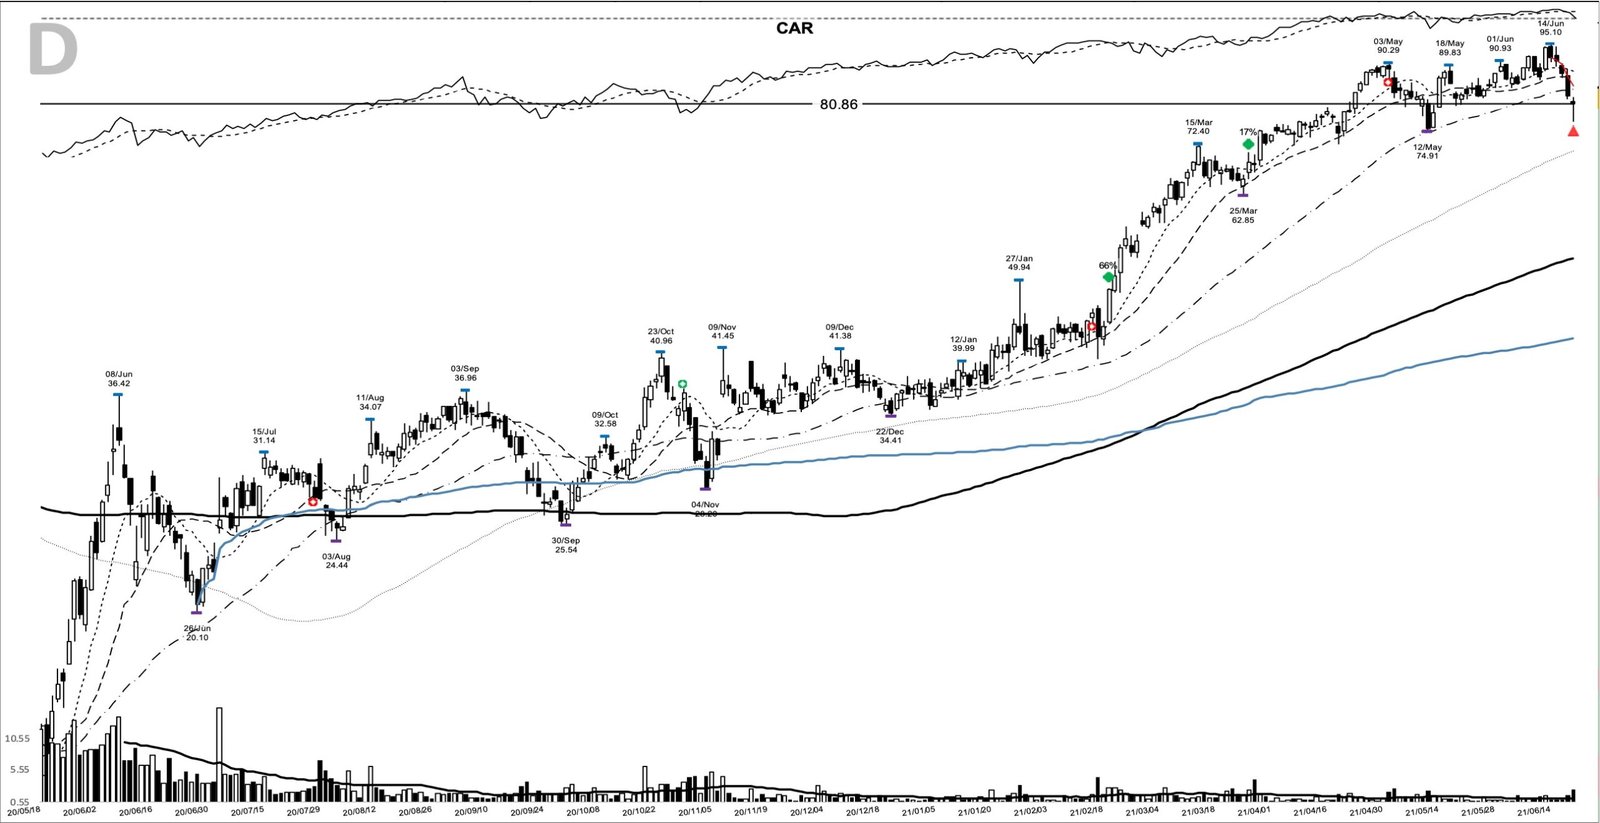
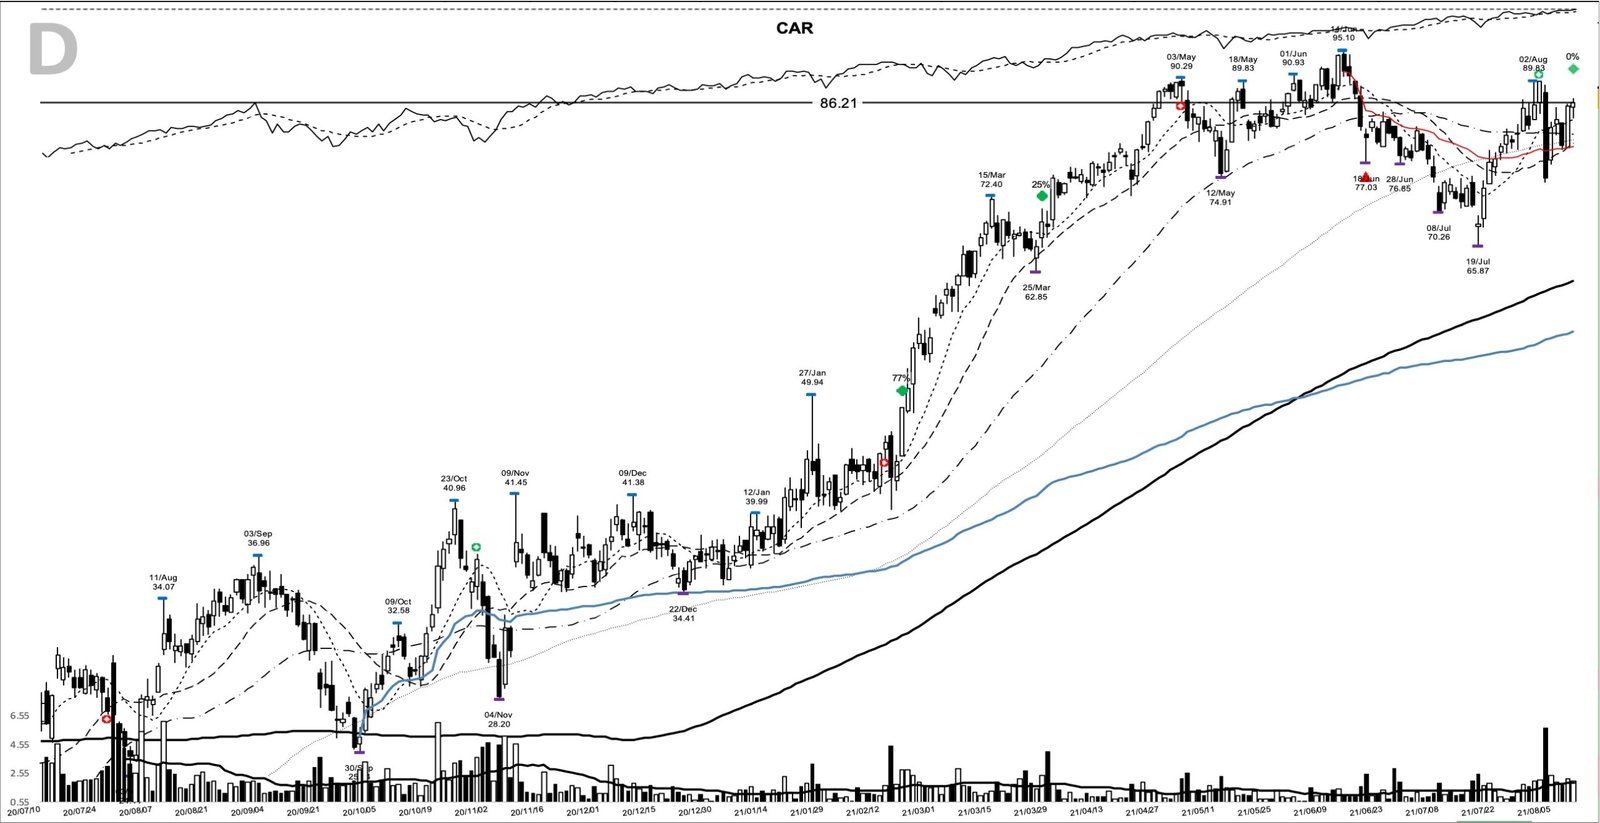
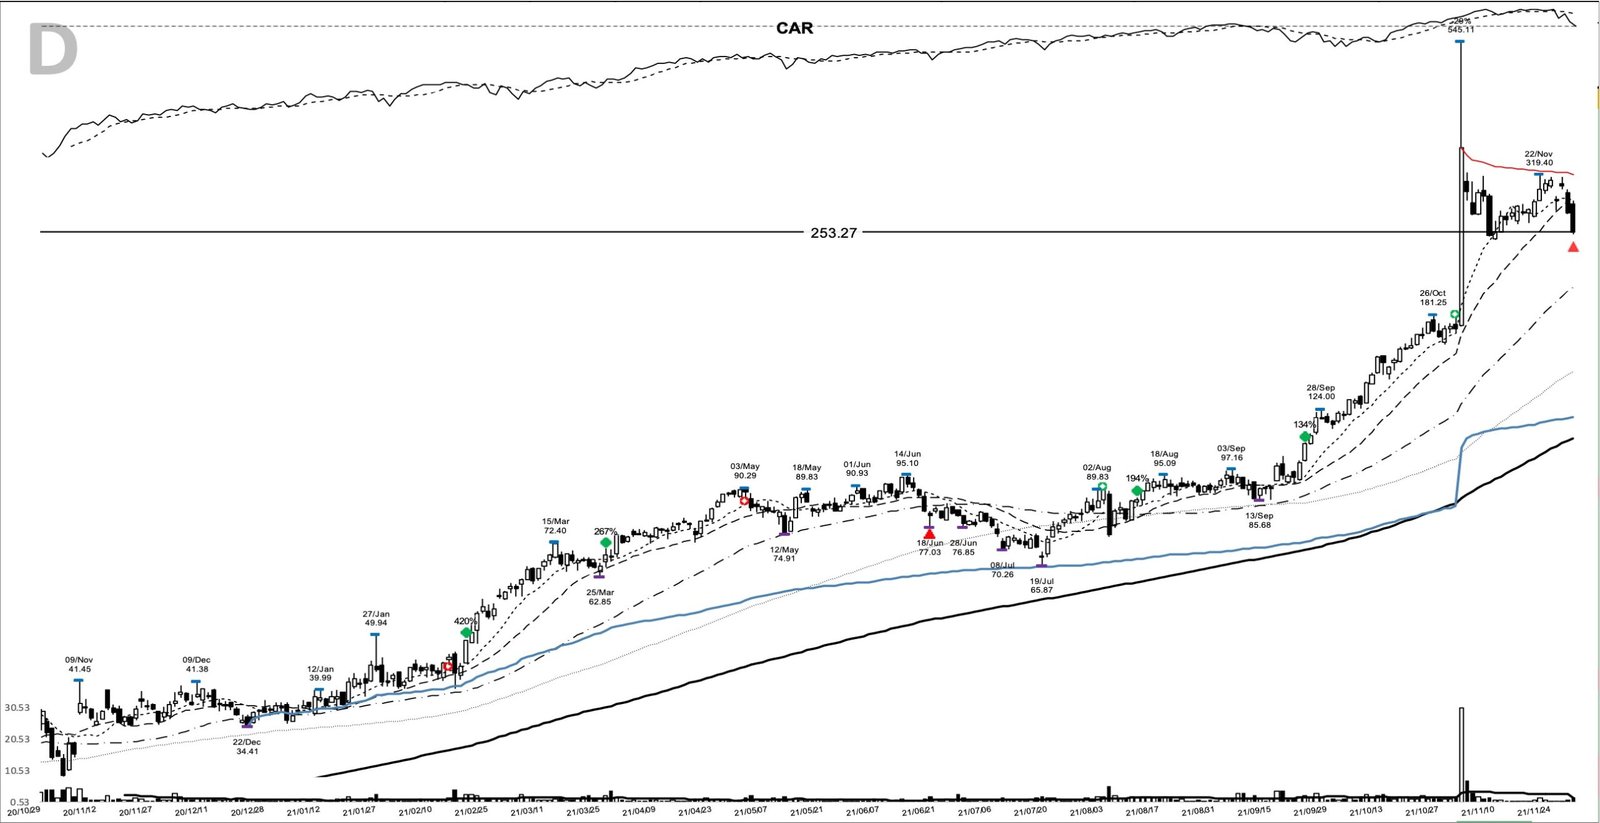
A trader using this pattern might have let the trend define the exit. The advance kept resetting and offering continuation entries as it climbed: 69.00 on 26 March, then 86.21 on 11 August, then 108.13 on 23 September, each a higher shelf on rising ground. There was even a sell marker at 80.86 on 18 June during a spring pullback, a point where a nervous hand might’ve stepped off early.
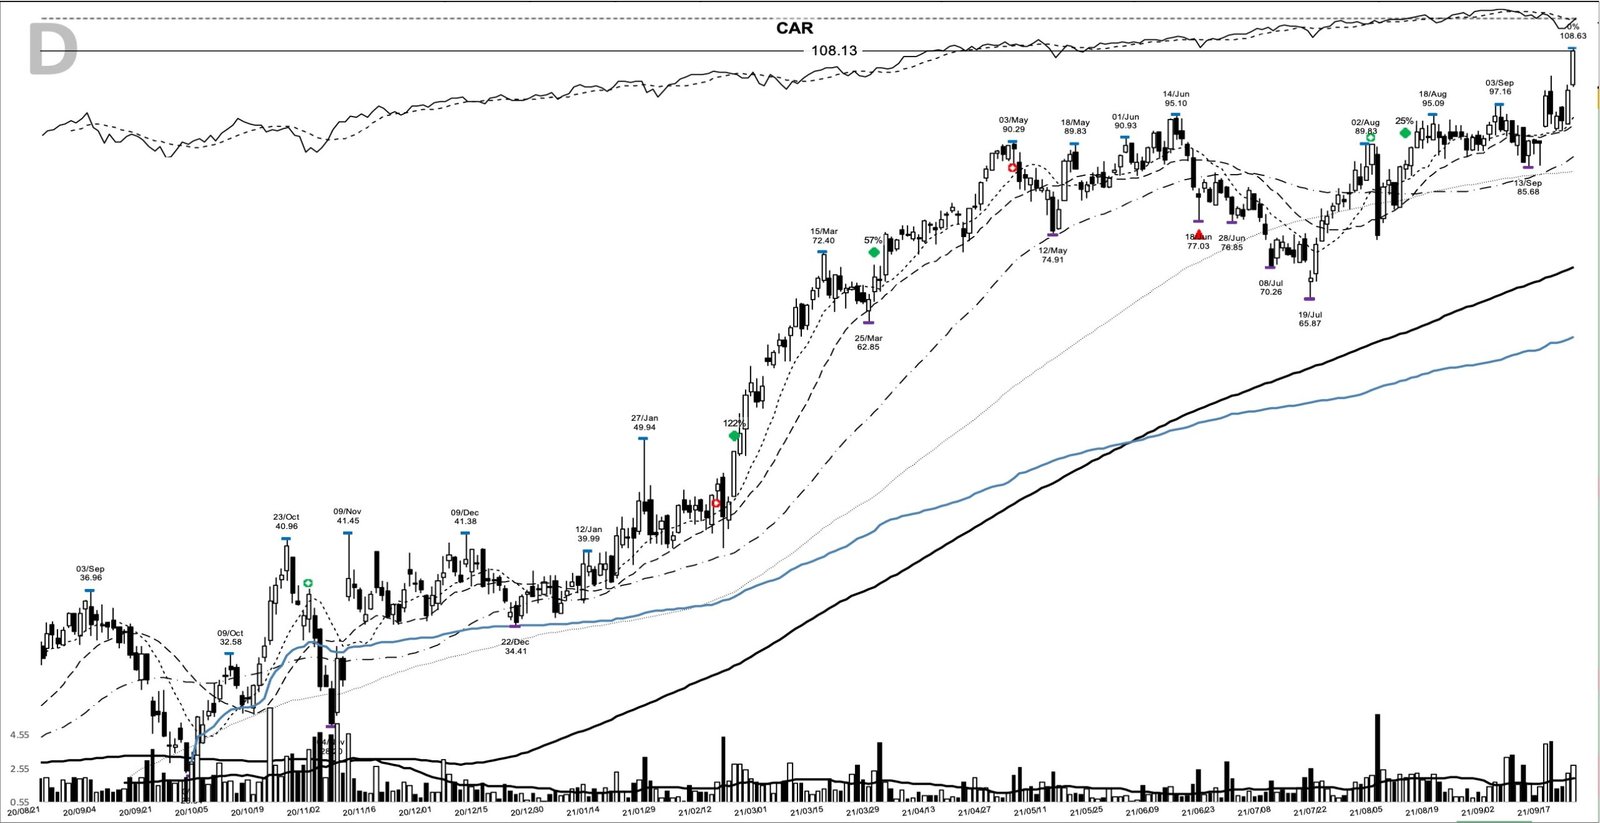
The finale was extraordinary. On 2 November 2021 a strong quarterly report and an offhand comment about electric vehicles lit a short squeeze, and the session closed at 357.17 after printing an intraday high of 545.11, the peak of the entire run. Chasing that bar was its own trap: you’re paying up for the single highest print of the run, and that’s exactly what the chart makes plain.
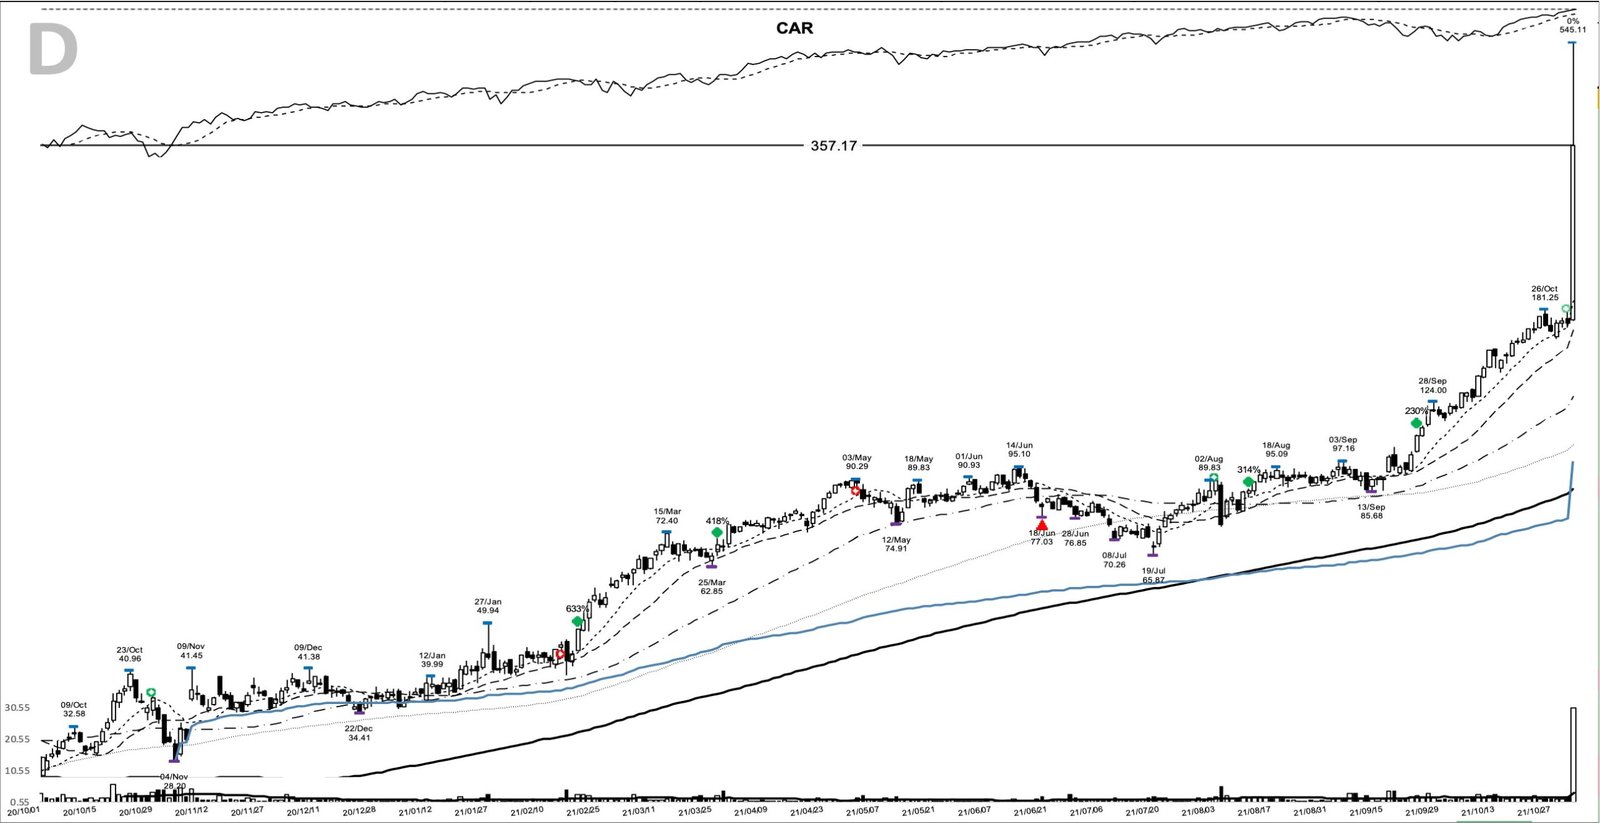
The exit came on 1 December 2021 at a close of 253.27, closing the move 419.5% above the entry close across 285 calendar days. As an illustration only, 1,000 dollars riding the full move would’ve become about 5,195 dollars. The gap between that exit and the 545.11 peak is the honest cost of trailing a trend instead of calling a top.
December opened with the tape confirming the decision. A fast, high-volume volatility shock pushed the Nasdaq back toward its 50-day line, breadth had been thinning for weeks before the headlines, and leadership had narrowed to a handful of names. Exits taken on the stock’s own break, ahead of the index admitting trouble, are how a 285-day hold ends without giving the year back.
Common misreads on the CAR base breakout
The first misread is treating the 19 February close as a low-risk entry. Buying it there, you’re paying about 10.2% above the 10-day line after only two closes back above it, a stretched spot. The calmer options were the 22 February clear of the 49.94 pivot on a 50.50 close, or a pullback toward the rising 10-day line.
The second is forgetting how deep the base was. A 48.9% range is a deep base, well beyond the tight, low-failure shelf the textbook prefers, so the stop below the 40.25 shelf did real work. Skip it and you’re handing the whole gain back in a bad tape.
The third lives on that 2 November bar. The close of 357.17 with a 545.11 high was a squeeze blow-off, and reading its add mark as a normal continuation entry, you’re buying a parabolic day that gave back to 253.27 within a month. The same lesson runs backward through 18 June: reading the pullback to 80.86 as the top would have cut the trade before another 213% to the exit. The plan kept you in; a hunch would’ve shaken you out.
What CAR’s 2021 run leaves on the chart
The takeaway’s quieter than a 419.5% number suggests. A defined pivot at 49.94, a small stop under 40.25, a rising set of moving averages and a business turning up gave a trend follower a large, open-ended reward for a modest, known risk. The rest was patience and a trailing stop. Learn the pattern. Ride the trend. Keep the gains.
Related studies: the base-and-breakout logic here sits alongside the CAN SLIM system, the volume read in hard drawdown stops, and the discipline in the pre-trade checklist. A fresh winner study lands most evenings.
Price and volume figures are computed from split-adjusted daily OHLCV data; company figures come from SEC filings where cited.
Educational content only. Not investment advice. Trading involves risk. You are responsible for your decisions.
Get the free Market Wisdom e-book
Join Trends and Breakouts — historical winners, breakout studies, and risk lessons. No spam, unsubscribe anytime.