AMC is back on the retail trackers this month, and it’s worth pulling up the chart from the last time it ran rather than the headlines around it. In February 2021 the stock had already crashed back from its January meme spike, the theaters were shut, and the company was selling shares to stay solvent. None of that stopped a clean AMC base breakout from setting up on the daily chart. A close at 65.5 on 22 February reclaimed a two-week shelf, the trend took over, and the move ran +500.8% over 141 calendar days into the June squeeze.
This is a trend-following study, so here’s the lesson, simple and a little uncomfortable: the tape led, the story never did. The charts below come from my study archive.
Key takeaways
- The pattern was a base breakout off a deep post-spike base, triggered on a close at 65.5 that reclaimed the February shelf, not a break of the old January high at 203.6.
- The realized move was +500.8% over 141 calendar days, from the 22 February 2021 entry to the 13 July exit close of 393.5.
- The stock peaked at 726.2 on 2 June, so the paper gain topped 1,000% before the trend rolled over, and the exit gave back a large slice of it.
- There were two clear opportunities to add as price broke to new highs on heavy volume, at 127.7 on 13 May and 136.8 on 24 May.
- The fundamentals were falling apart the whole time. Following price and a defined stop is what made the trade, not the earnings.
AMC at a glance: the February 2021 trade
| Field | Value |
|---|---|
| Ticker | AMC |
| Study entry date (anticipatory) | 22 February 2021 |
| Entry close | 65.5 |
| Pivot | 203.6 |
| Pivot cleared | 27 May 2021 at a close of 265.2 |
| Volume vs 20-day average | 0.6x |
| Exit date | 13 July 2021 |
| Exit close | 393.5 |
| Gain | 500.8% |
| Calendar days | 141 |
| Peak before exit | 726.2 (2 June 2021) |
How the AMC base breakout actually formed
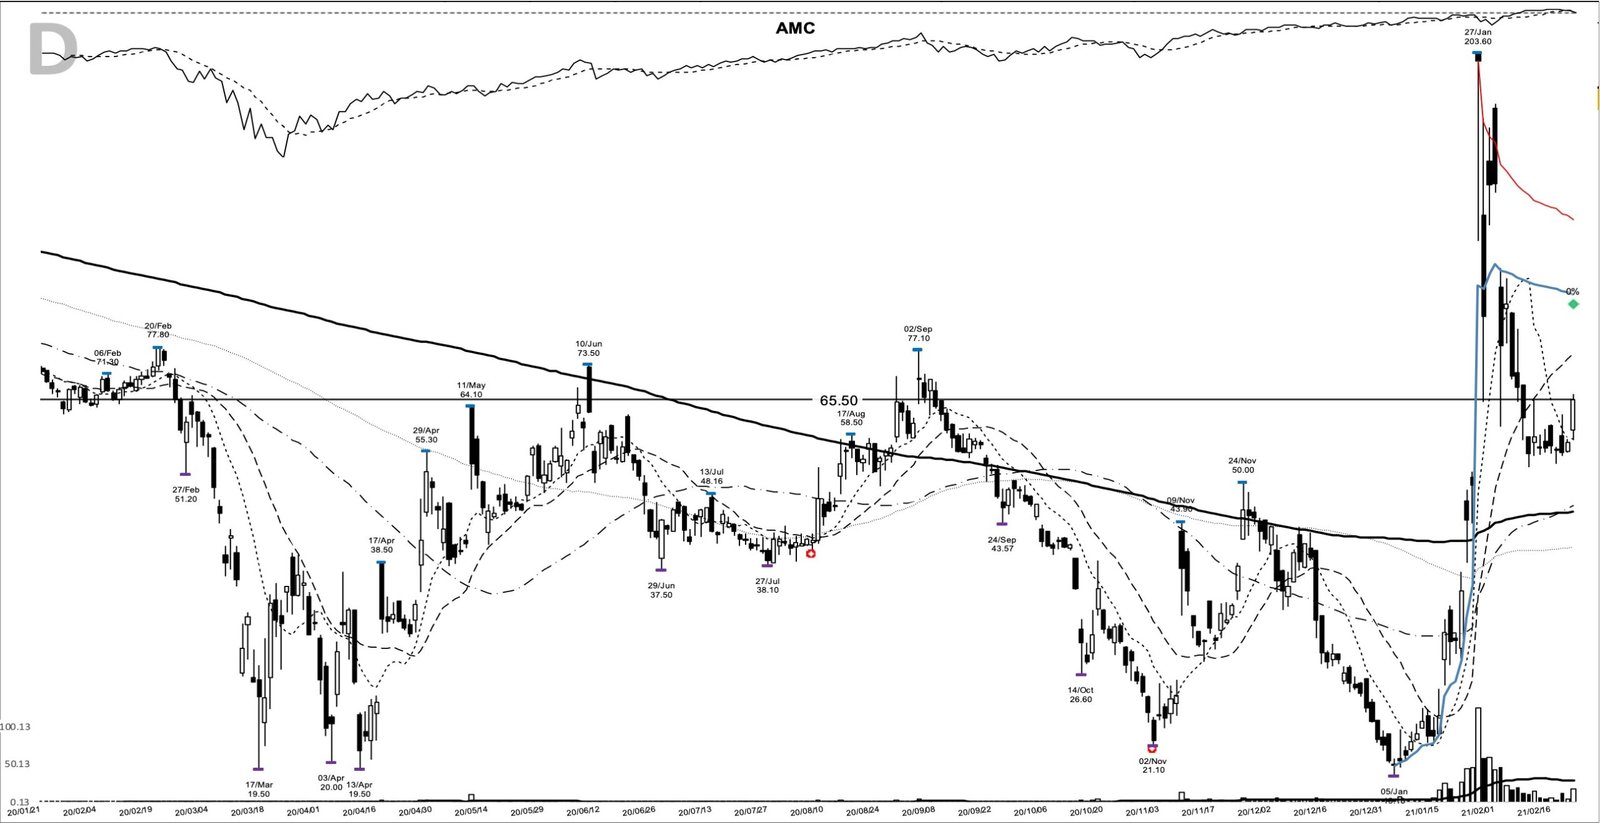
Read the chart left to right and the AMC base breakout tells a strange story. Price spent all of 2020 sliding, from the low 70s in January down to 19.1 by 5 January 2021 as the pandemic kept theaters dark. Then a single vertical bar to 203.6 on 27 January stands away from everything around it, the January meme spike that ran alongside the GameStop squeeze. It collapsed almost as fast.
What formed next was the part that mattered. Through February the stock built a tight shelf, holding a low of 53.2 on 17 February and capping out near the 62.5 high from 18 February. On 22 February it closed at 65.5, up about 15% on the day, clearing that shelf and closing back above its 10-day moving average near 57.64 for the first time in the sequence. That reclaim is the breakout.
By the letter of the pattern, this entry was anticipatory. The 65.5 close sat far below the 203.6 pivot, the old January high, and price did not clear that pivot until 27 May, on a close of 265.2.
One honest caveat lives in the volume line. Entry-day volume of 17.3 million printed at just 0.6 times the 20-day average of 29.3 million, so the entry came on below-average volume. A base breakout is supposed to fire on a volume thrust, and this one did not. The average was itself swollen by January’s frenzy, but 0.6x is still not volume confirmation, and the entry went without it. That confirmation showed up later, in May, and that’s exactly where the two add points sit.
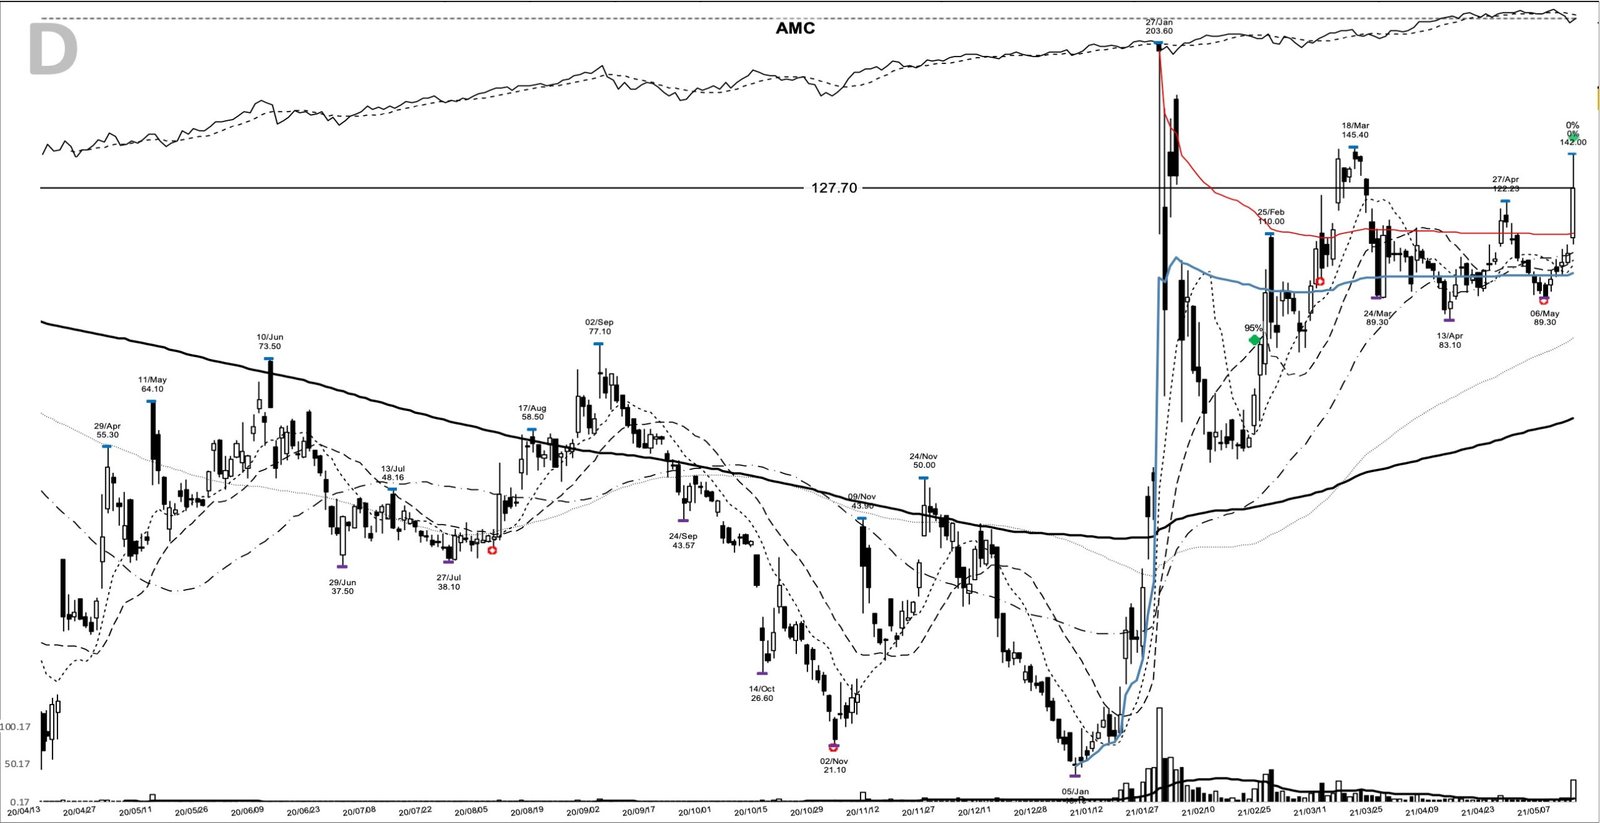
By spring the trend had done real work. On 13 May the stock gapped to a 127.7 close on more than five times the prior session’s volume, clearing the April ceiling at 122.23. There was an opportunity to add right there, into strength and expanding participation. The classic base-breakout signature that the 22 February entry lacked, price clearing resistance on a volume thrust, arrived in full here.
A broken business behind a running stock
The business behind the ticker was in trouble, and the filings say so plainly. Revenue for the December 2020 quarter came in at 162.5 million, down 88.8% from a year earlier, after the June 2020 quarter cratered to 18.9 million, a 98.7% collapse as theaters sat closed. Earnings per share ran deeply negative through 2020: -20.88 in the March quarter, then -5.38, -8.41, and -6.21 in the three that followed.
There was no earnings-growth engine here, none of the accelerating fundamentals a model-book leader usually shows. The story investors argued over was survival. AMC was raising cash by selling stock into the market to avoid a bankruptcy filing, and a wave of retail buyers on Reddit turned that fragile setup into one of the defining short squeezes of the era. High short interest and, later, an options gamma squeeze poured fuel on the move. A trader following the method only needed two things the chart already offered: a trend, and a stop. The story was optional.
The tape in early 2021
Backdrop matters, and early 2021 was a friendly tape for this kind of trade. The broad market was in a strong post-COVID uptrend, stimulus and low rates had pulled a wave of new retail participants into stocks, and the meme-stock phenomenon was rewarding exactly the crowded, heavily shorted names that AMC led. A runaway momentum move needs a market willing to chase, and this one obliged.
Friendly needs a qualifier, though. The very week of the entry, the broader growth complex was absorbing a violent shakeout, trading had turned wide and loose, and the careful posture of the moment was patience for ideal setups. AMC ran on its own engine, crowd flow rather than institutional accumulation, and that is exactly why the risk plan below did the heavy lifting.
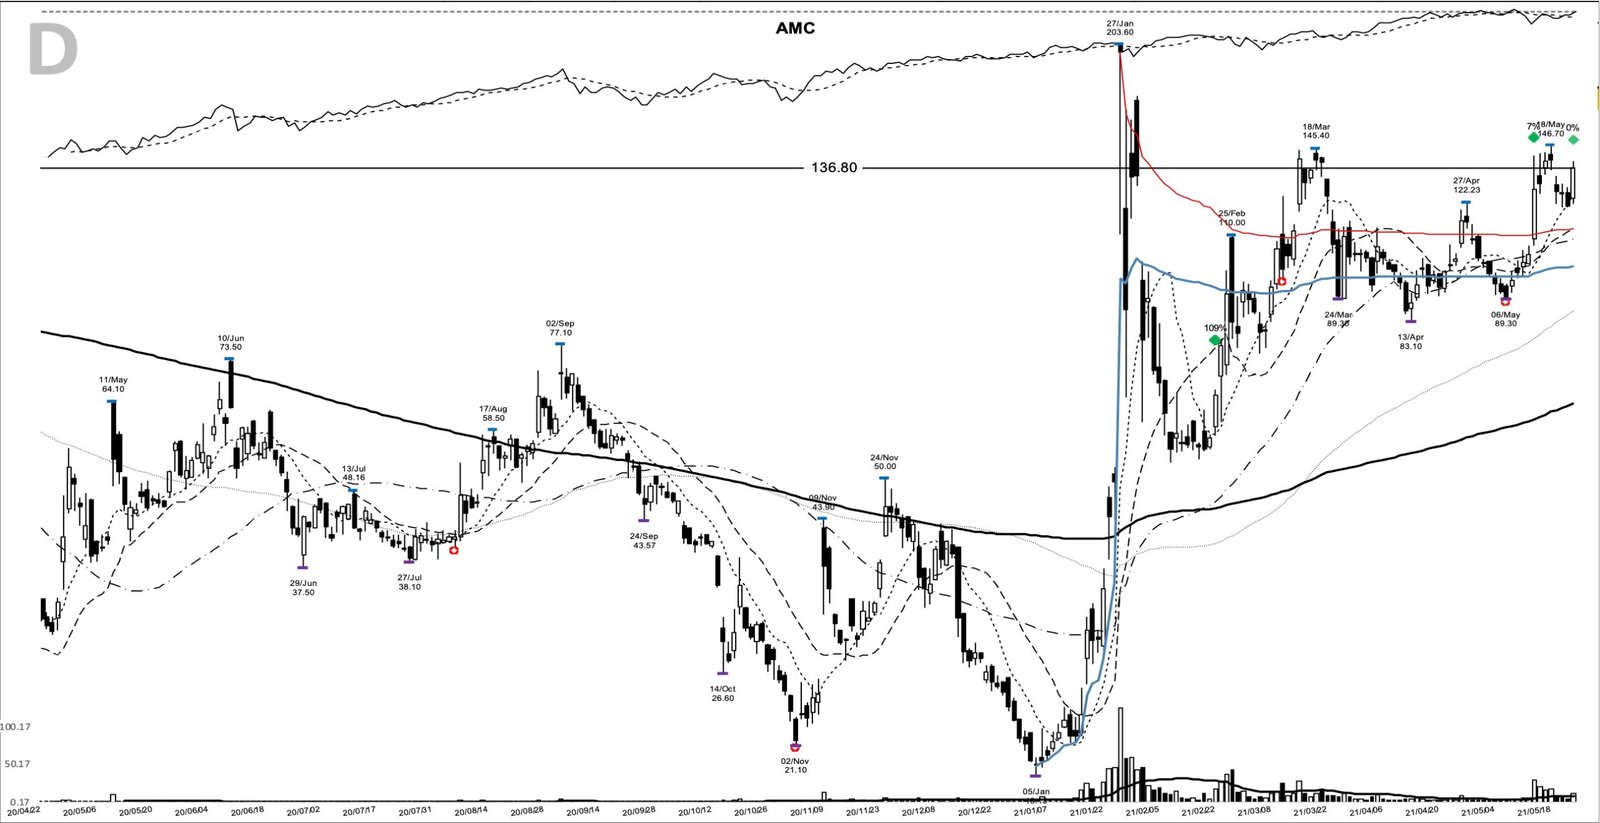
The second add point came on 24 May at a 136.8 close, as the stock pressed toward and then through the March high near 144.9, printing 164.1 the very next session. Each add came higher, into confirmed strength, never on a hope-and-hold dip. That’s the whole discipline of pyramiding a trend: you pay up for proof.
Spotting the AMC setup before the breakout
The trend posture into 22 February was readable in advance. Price had just closed back above its 10-day line near 57.64, sitting 13.6% above it, with the 50-day near 46.47 curling up underneath. The one distortion was the 20-day near 76.41, dragged high by the January spike. A watchlist trader would’ve flagged a heavily shorted, high-volatility name carving a tight two-week shelf above a rising short-term average.
The trigger a trader could’ve written that morning keyed off the shelf, not the distant 203.6 high. A close back above the 62.5 shelf top, which came at 65.5, was the entry cue. The initial stop belonged just under the 53.2 shelf low, with the 19.1 base low as the level where the whole structure fails. From there the plan was mechanical: trail the 10-day moving average near 57.64, widening to the 20-day near 76.41 once the move was well advanced. Held through the full move, 1,000 at the entry would have become about 6,008 by the exit.
For the mechanics of paying up on confirmation, volume confirmation on breakout candles and position sizing are the two pieces to get right before the entry, not after.
How the trend played out into July
A trader using this pattern might have watched for higher highs holding above a rising 10-day line, and that’s what the record shows. From the 65.5 entry the stock worked higher through the spring, then went vertical in late May as the second squeeze detonated. It cleared the old 203.6 January high on the way, and topped at 726.2 on 2 June, a paper gain north of 1,000%.
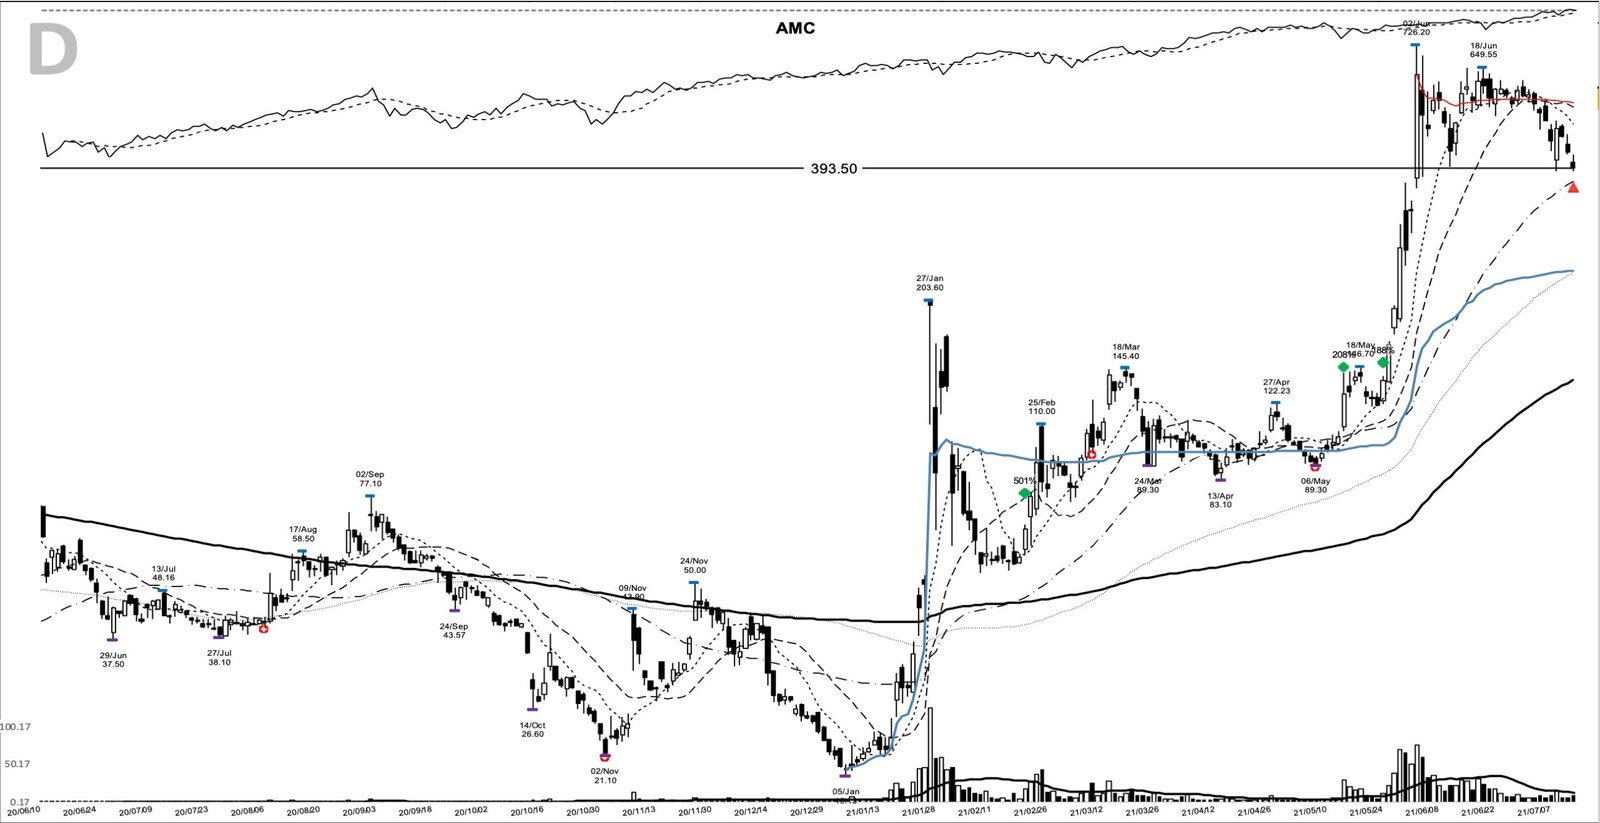
The exit is the honest part. By 13 July the trend had broken and the close was 393.5, a realized +500.8% from the entry over 141 calendar days. That’s a huge win, and it’s also barely half of the +1,008.7% the peak briefly showed. The distance between 726.2 and 393.5 is why a trailing stop, not a price target, defines this kind of exit. You give back the top; you keep the trend. That’s the Livermore lesson about sitting through a big move and then letting the market, not your opinion, tell you it’s over.
The July tape underlined the point. Headline indexes sat near records while the market underneath had gone narrow and hostile, full of failed breakouts and sharp reversals, the kind of environment where a delayed exit turns a manageable giveback into a large one. Exiting on the stock’s own broken trend, with the indexes still looking calm, was the discipline earning its keep.
Where this AMC setup fools people
The first trap is the pivot. It’s tempting to call the 203.6 January high the level to trade, but a trader who insisted on a clean break of it before entering would’ve stayed out until late May and missed the run from 65.5, roughly a triple, before the stock ever reclaimed that price. On a post-spike chart the mechanical 52-week high is stale supply, not the actionable pivot.
The second trap is reading too much into that 0.6x entry volume, or too little. A sub-average volume breakout is usually a warning, and most of them fail. This one worked because the average was distorted and the trend confirmed within days, but the setup that looks like this and dies is far more common than the one that runs. Survivorship cuts hard here, and it’s worth remembering before you treat one AMC chart as a blueprint.
The last trap is mistaking the squeeze story for the edge. The short interest, the Reddit threads, the gamma, all of it was noise a disciplined trader could ignore. What repeated was structural: a base, a reclaim, adds on strength, a trailing stop. The narrative was different every time; the method was the same.
Follow the price, not the story
AMC in 2021 is the cleanest reminder that trend following is a method for acting on price and risk when the fundamentals give you nothing to hold. A near-bankrupt theater chain produced a five-fold move, and the only way to have caught it was to trade the chart in front of you, add on confirmation, and let a trailing stop end the trade. Learn the pattern. Ride the trend. Keep the gains.
Related studies: for more on the breakout playbook behind this trade, see William O’Neil on base breakouts, the CANSLIM system, and how survivorship bias flatters a single winning chart. A new winner study lands most evenings.
Price and volume figures are computed from split-adjusted daily OHLCV data; company figures come from SEC filings where cited.
Educational content only. Not investment advice. Trading involves risk. You are responsible for your decisions.
Get the free Market Wisdom e-book
Join Trends and Breakouts — historical winners, breakout studies, and risk lessons. No spam, unsubscribe anytime.