NIO’s back on the StockTwits trending list this week, and a mid-July 2026 upgrade to buy from Goldman Sachs is a big reason why. That makes now a good time to study the NIO base breakout of May 2020, the setup that turned a near-bankrupt stock into one of the largest moves on the board. A long bottoming base gave way, the entry was marked at a close of 3.82, and price ran roughly 1,227% over the next 272 days.
This study is about what it takes to hold a leader through a months-long move. NIO ran hard, stalled, shook out weak holders, and gave back about a third of its peak before the exit. Staying in that kind of trend is the hard part, and the chart shows you exactly where the tests came.
Key takeaways
- The pattern: a long bottoming base with the entry marked on 26 May 2020 at a close of 3.82, just under the 3.98 pivot, on volume running 1.8 times the 20-day average.
- The move: +1,226.7% from the 3.82 entry to the 50.68 exit on 22 February 2021, a hold of 272 calendar days.
- The adds: seven marked add-on points, from 7.72 on 30 June 2020 up to 48.38 on 30 December 2020, each a chance to build into strength.
- The peak: price reached a high of 66.99 on 11 January 2021 before the trend rolled over and the exit gave part of it back.
- The takeaway: a rising 10-day, then 20-day, moving-average trail kept the position alive far longer than any fixed price target would have.
The NIO trade at a glance
| Metric | Value |
|---|---|
| Ticker | NIO |
| Study entry date (anticipatory) | 26 May 2020 |
| Entry close | 3.82 |
| Pivot | 3.98 |
| Pivot cleared | 27 May 2020 at a close of 4.17 |
| Volume vs 20-day average | 1.8x |
| Exit date | 22 February 2021 |
| Exit close | 50.68 |
| Gain | +1,226.7% |
| Calendar days held | 272 |
| Peak before exit | 66.99 (11 January 2021) |
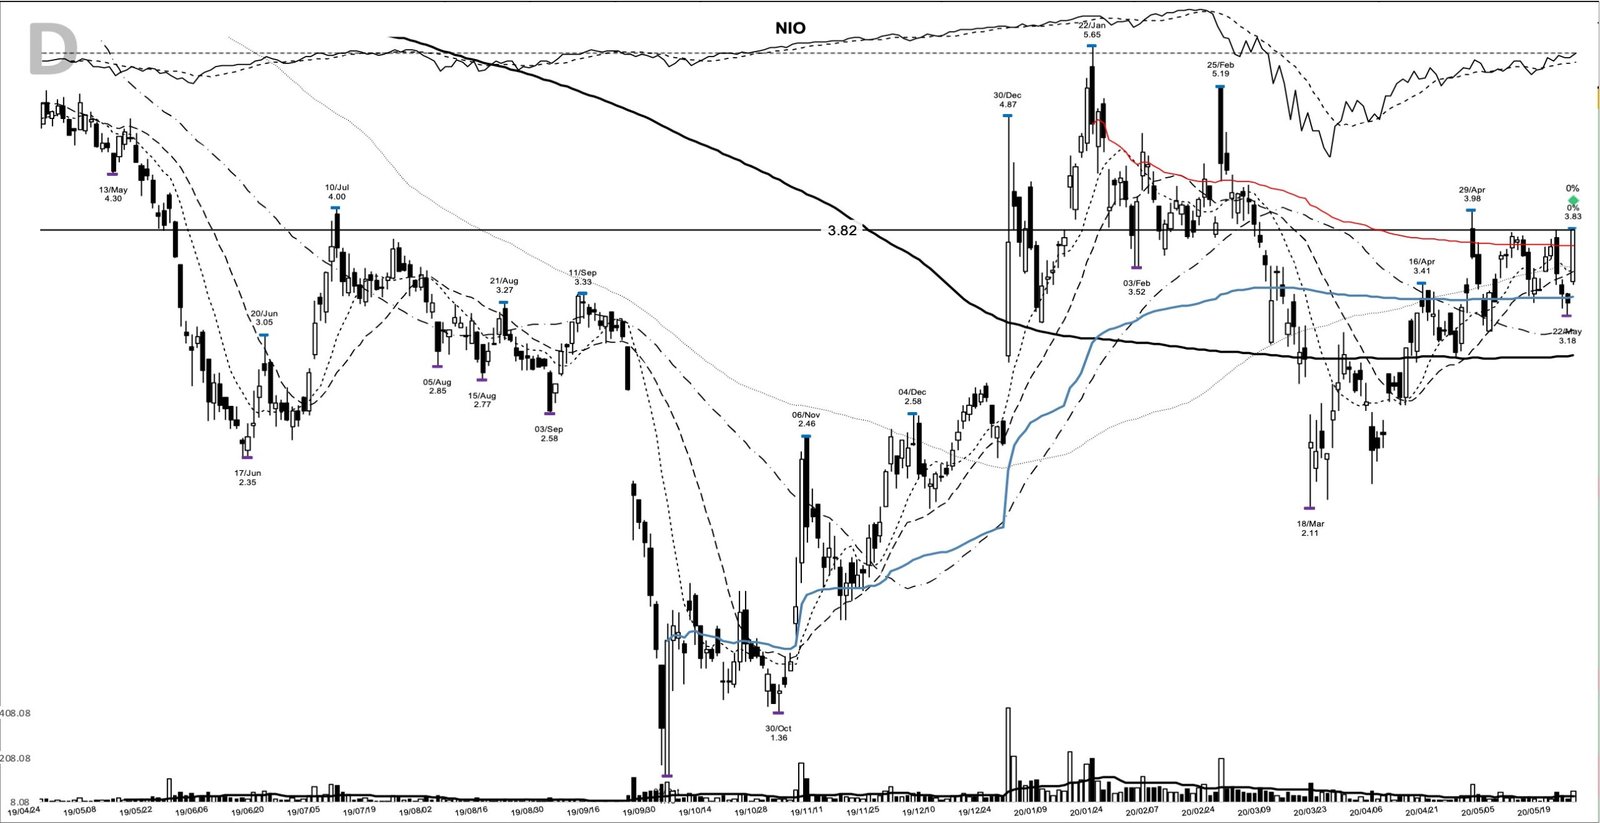
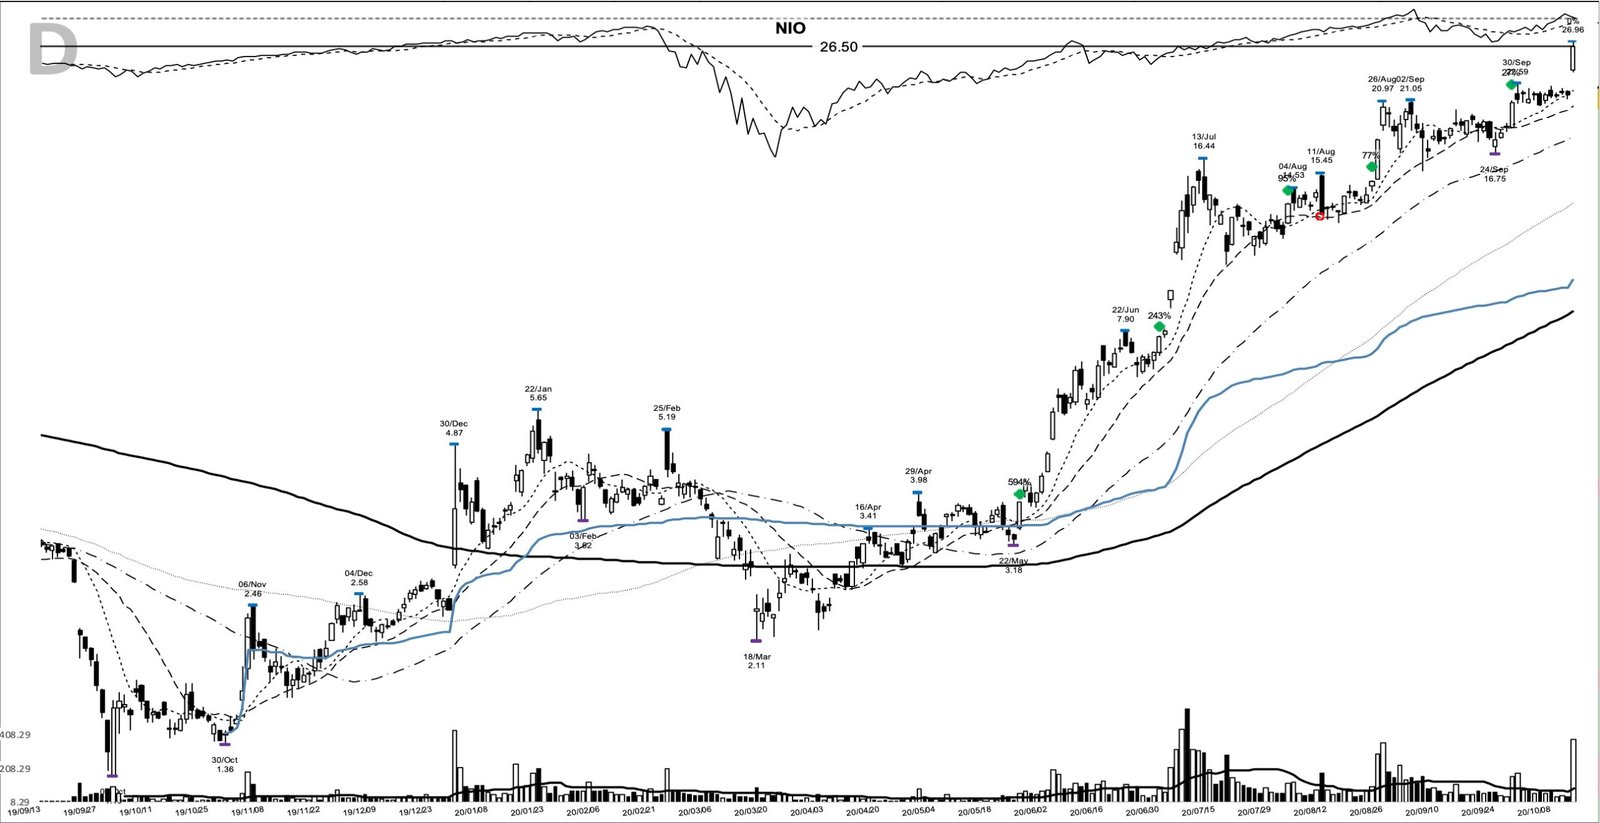
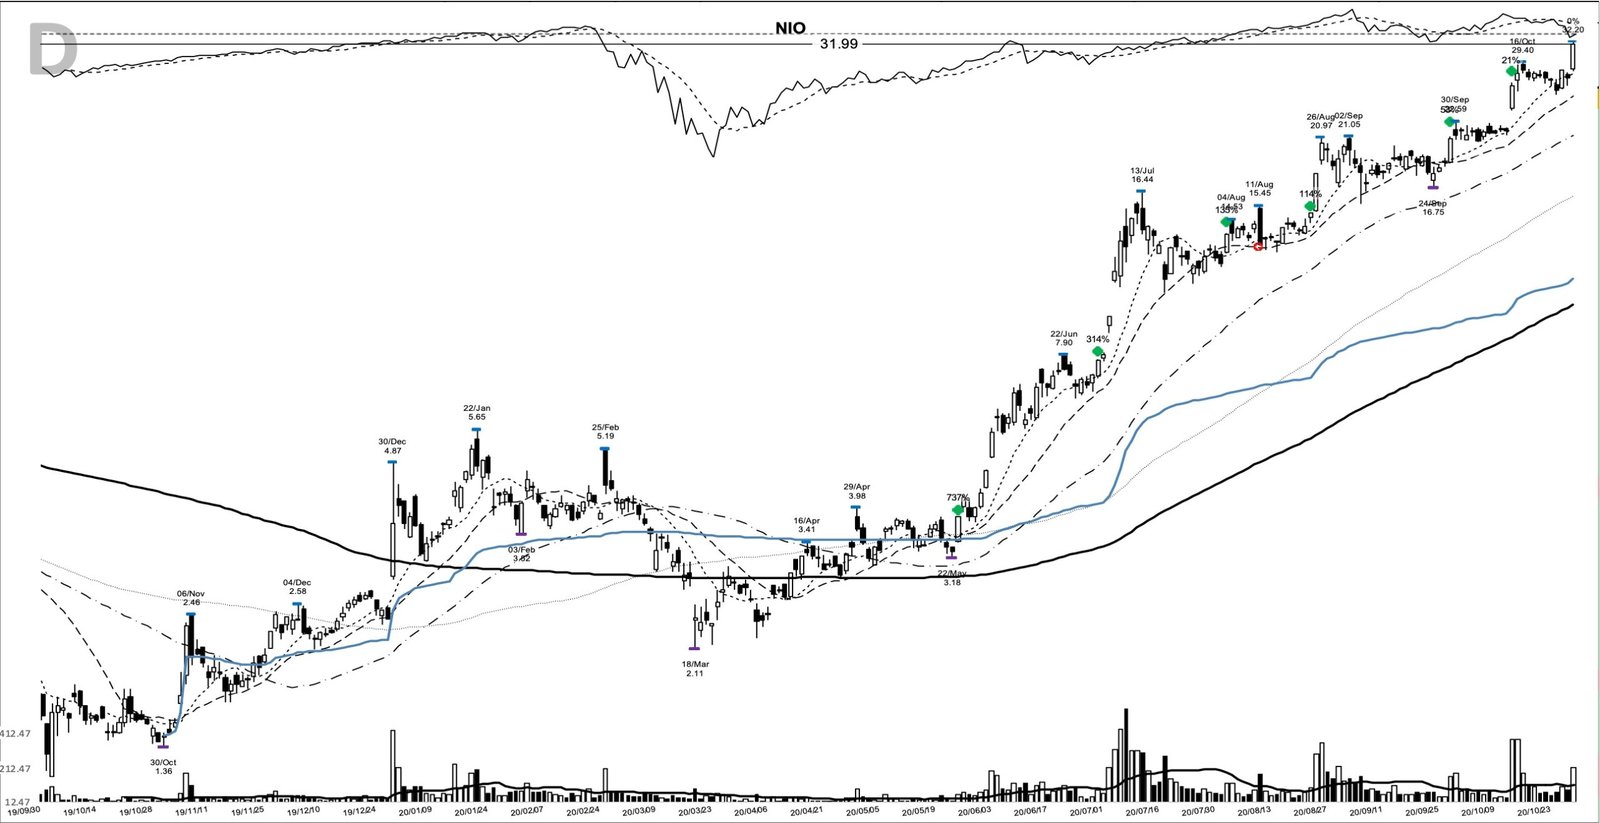
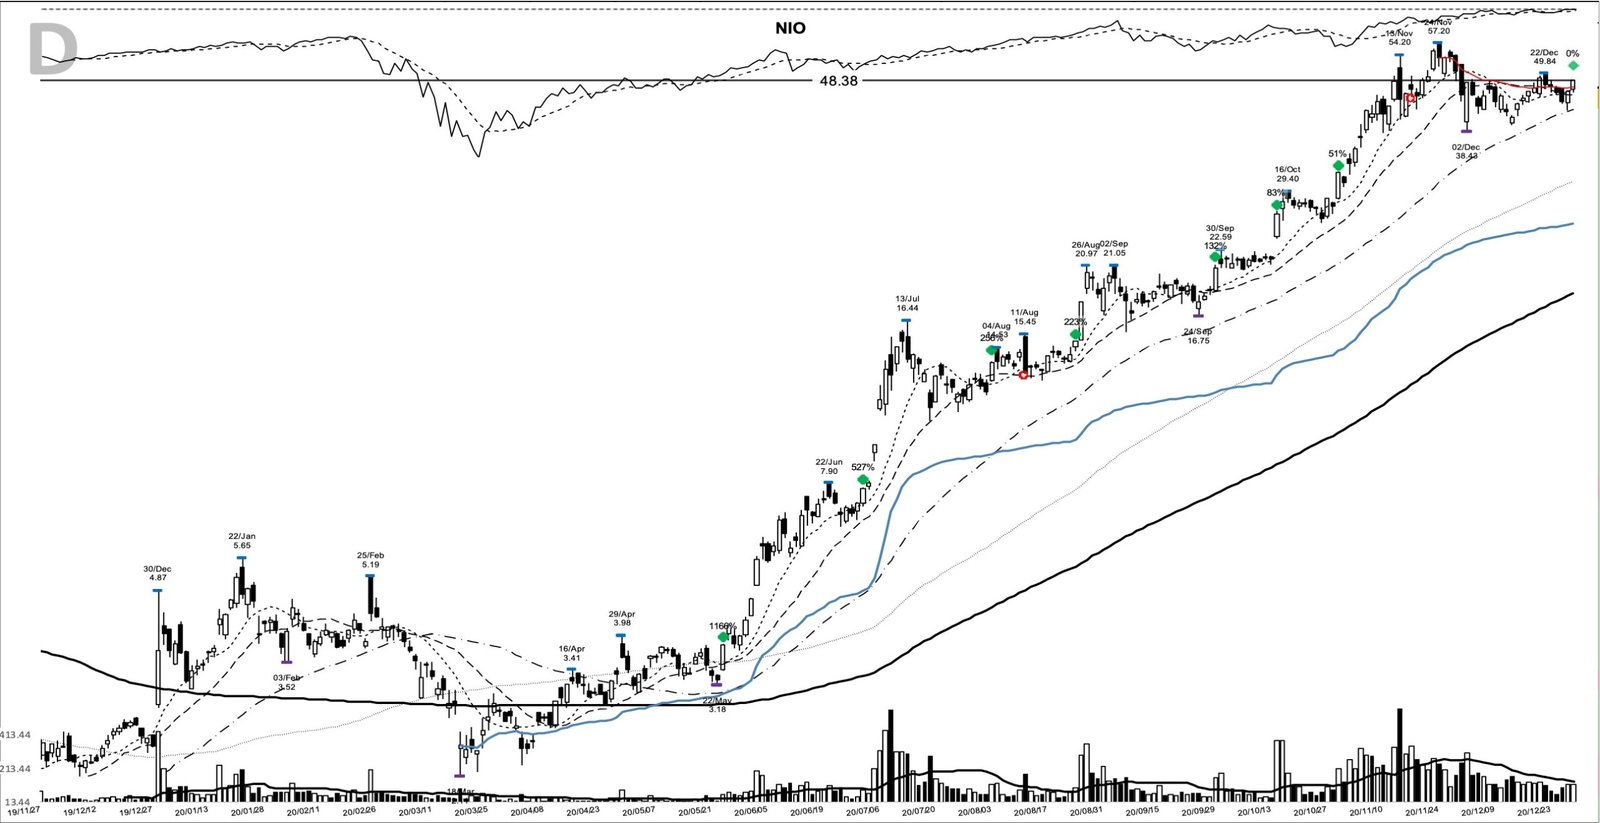
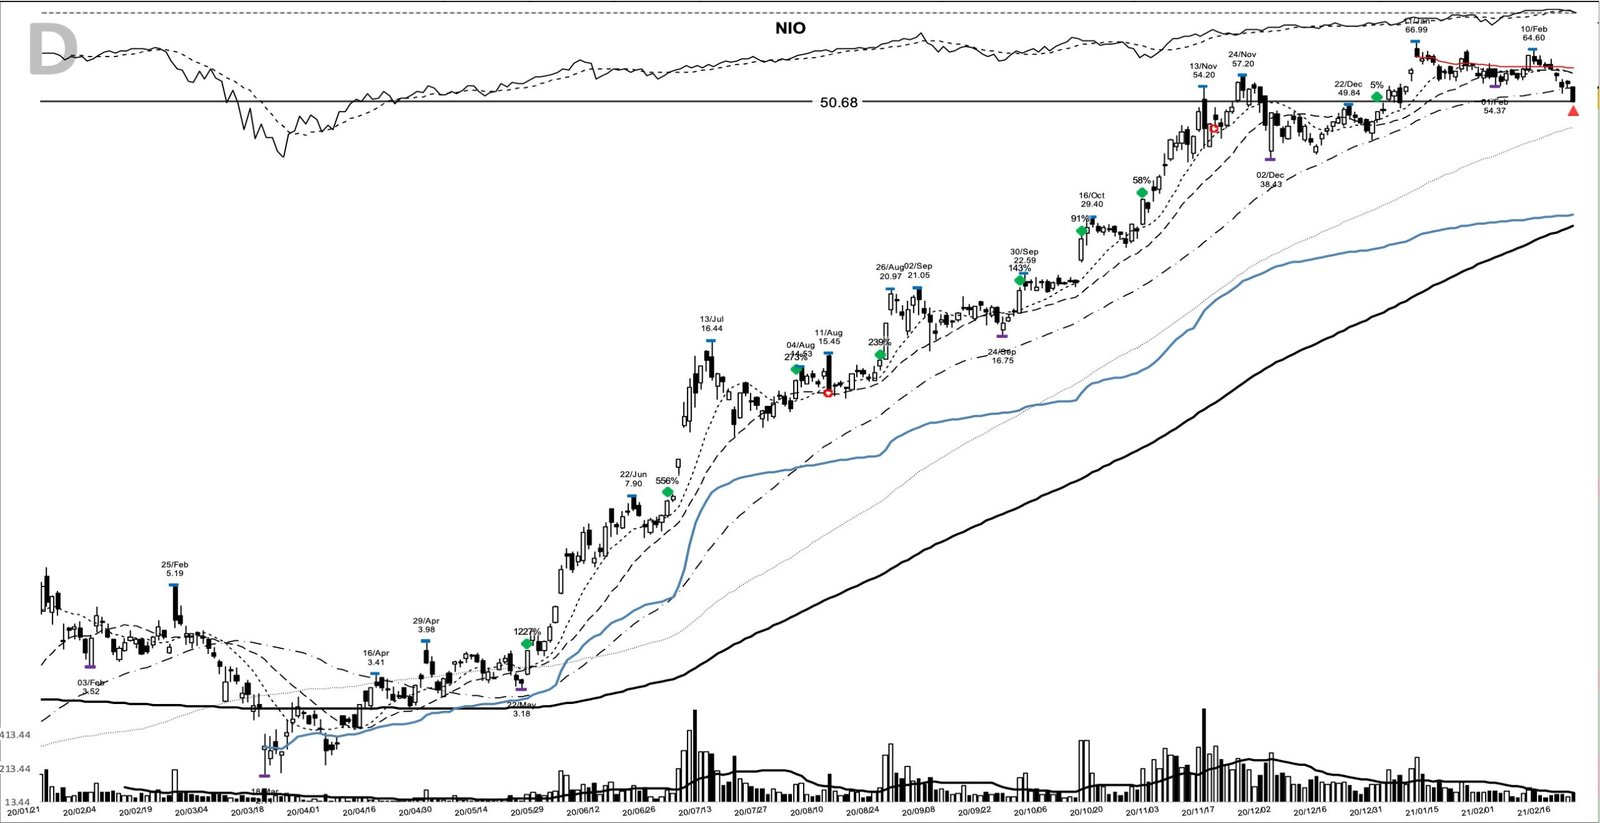
The chart below comes from my study archive, marked at the 26 May 2020 entry.
How the NIO base breakout set up in May 2020
NIO spent late 2019 and early 2020 carving a deep, messy base. The stock had collapsed from the 5.65 high of 22 January 2020 all the way to 2.11 on 18 March during the COVID crash, and before that it had bottomed near 1.19 in October 2019. By May the selling had dried up. Price coiled into a tight shelf, with the low of that shelf at 3.18 on 22 May 2020.
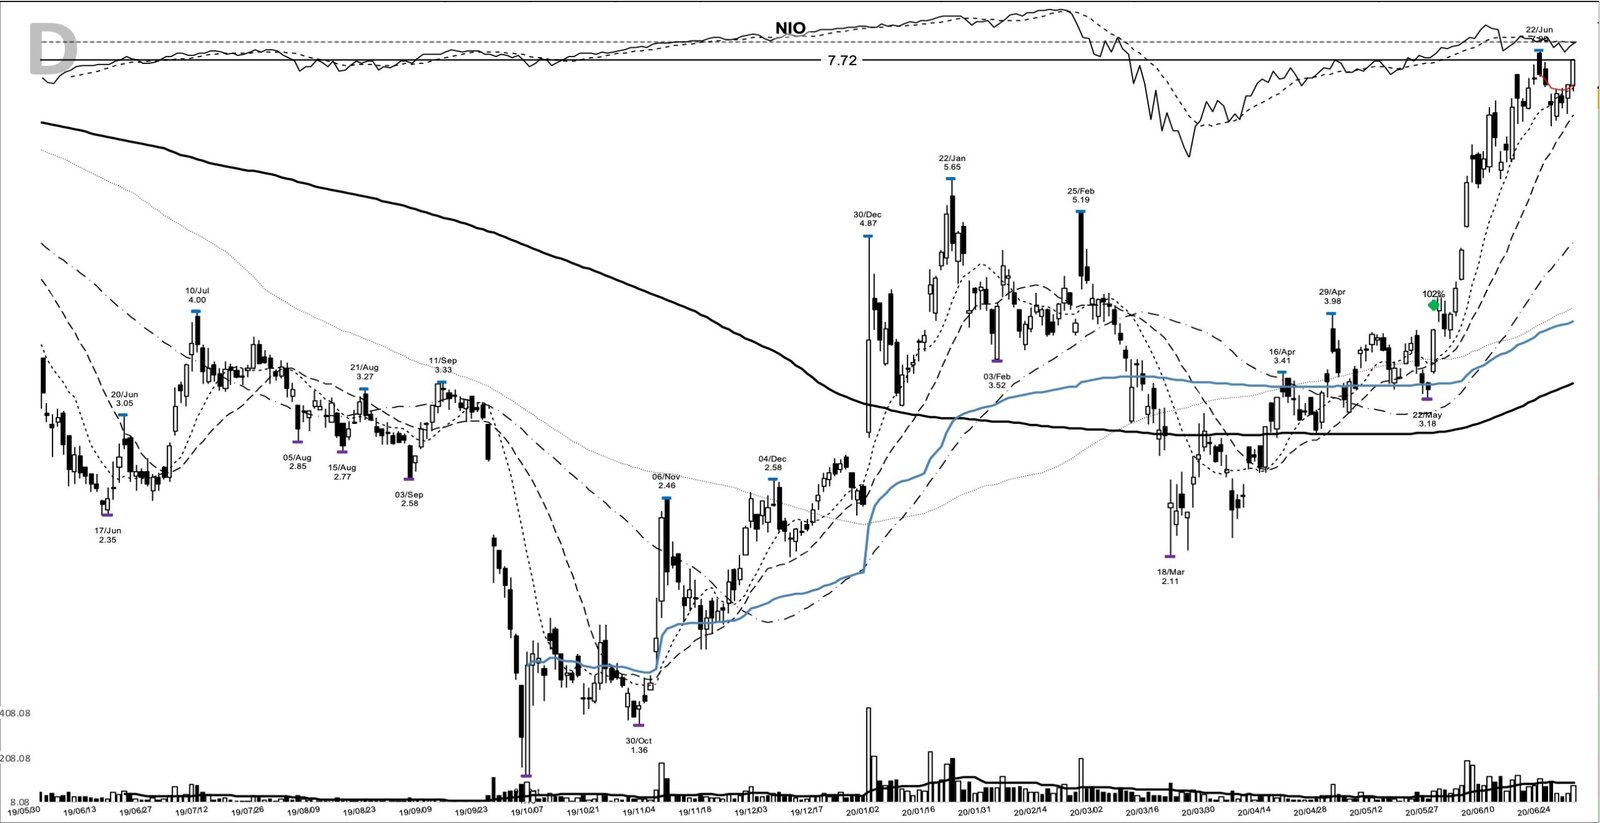
The resistance that mattered was the 20-day high at 3.98, printed on 29 April 2020. That’s the pivot. On 26 May, NIO gapped up and closed at 3.82, right under that pivot, on volume of about 59 million shares, roughly 1.8 times its 20-day average. The close sat just below the line, so the 3.82 bar counts as an anticipatory entry, marked below the 3.98 pivot before that level cleared.
Confirmation came the next session. On 27 May the stock pushed through 3.98 and closed at 4.17, and a week later, on 3 June, it closed at 5.60 on volume near 197 million shares. The base had resolved, and the trend was underway.
What NIO’s business looked like into the breakout
A base only becomes a launch pad when the story underneath it changes, and NIO’s did right as the chart tightened. Through late 2019 the company traded on genuine bankruptcy fear. In April 2020 it agreed to a strategic investment of roughly 7 billion yuan, about 1 billion dollars, from investors tied to the city of Hefei, in exchange for a stake in its main China operating entity. That deal refilled the balance sheet and removed the survival question that had capped the stock all year.
Demand was turning at the same time. Monthly deliveries were climbing back after the spring shutdown, and the premium end of China’s electric-vehicle market was starting to run. The clean quarterly earnings series these studies usually lean on isn’t available for NIO as a foreign filer, so the fundamental read here stays qualitative: a rescued balance sheet and recovering sales into a base that was already coiling. This is the kind of turn William O’Neil looked for behind a proper base breakout.
The tape in the spring of 2020
The backdrop did NIO no harm. After the March 2020 crash, the broad US market turned and ran one of its sharpest recoveries on record, and money crowded into growth and anything tied to electric vehicles. Leadership was narrow and strong, and that’s the tape that rewards a young leader clearing a base. A breakout like this in a heavy, falling market is a far riskier proposition. Here the wind was at the stock’s back.
What held that recovery together was policy: extraordinary fiscal and monetary support, rates near zero, and liquidity looking for a home. Support that broad floats weak companies along with strong ones, which is exactly why the volume demanded at the 3.98 pivot mattered. The tape could carry almost anything for a while; participation was what separated leaders from passengers.
Reading the NIO base before 3.98 gave way
Spotting this before the move meant watching the base tighten under a known level. The pivot was fixed: the 3.98 high from 29 April 2020. Below it, the shelf low at 3.18 on 22 May marked where the most recent consolidation would fail, and the deeper base low sat at 1.82 from 21 November 2019.
The trend posture supported a watchlist entry. Into the breakout the 50-day moving average had turned up to about 3.08, the 20-day sat near 3.50, and the 10-day near 3.51. On the entry bar price reclaimed that 10-day line and closed about 8.8% above it. One reclaimed short-term average is a start, not a trend, so the jump in volume to 1.8 times average was the tell that this push had real supply behind it. It’s the kind of confirmation you want before you size an entry.
From there the plan writes itself. A trigger just above the 3.98 pivot, an initial stop below the 3.18 shelf for a tight version or beneath the 1.82 base low for a wider one, then a trailing exit that follows the 10-day line early and widens to the 20-day once the move is well advanced. That structure is what let a holder ride 3.82 into the fifties instead of ringing the register at the first double.
How the NIO trend played out from 3.82 to 50.68
A trader using this pattern might have watched for the same two things all the way up: price holding above its rising short-term average, and volume showing up on the pushes. NIO gave both for months.
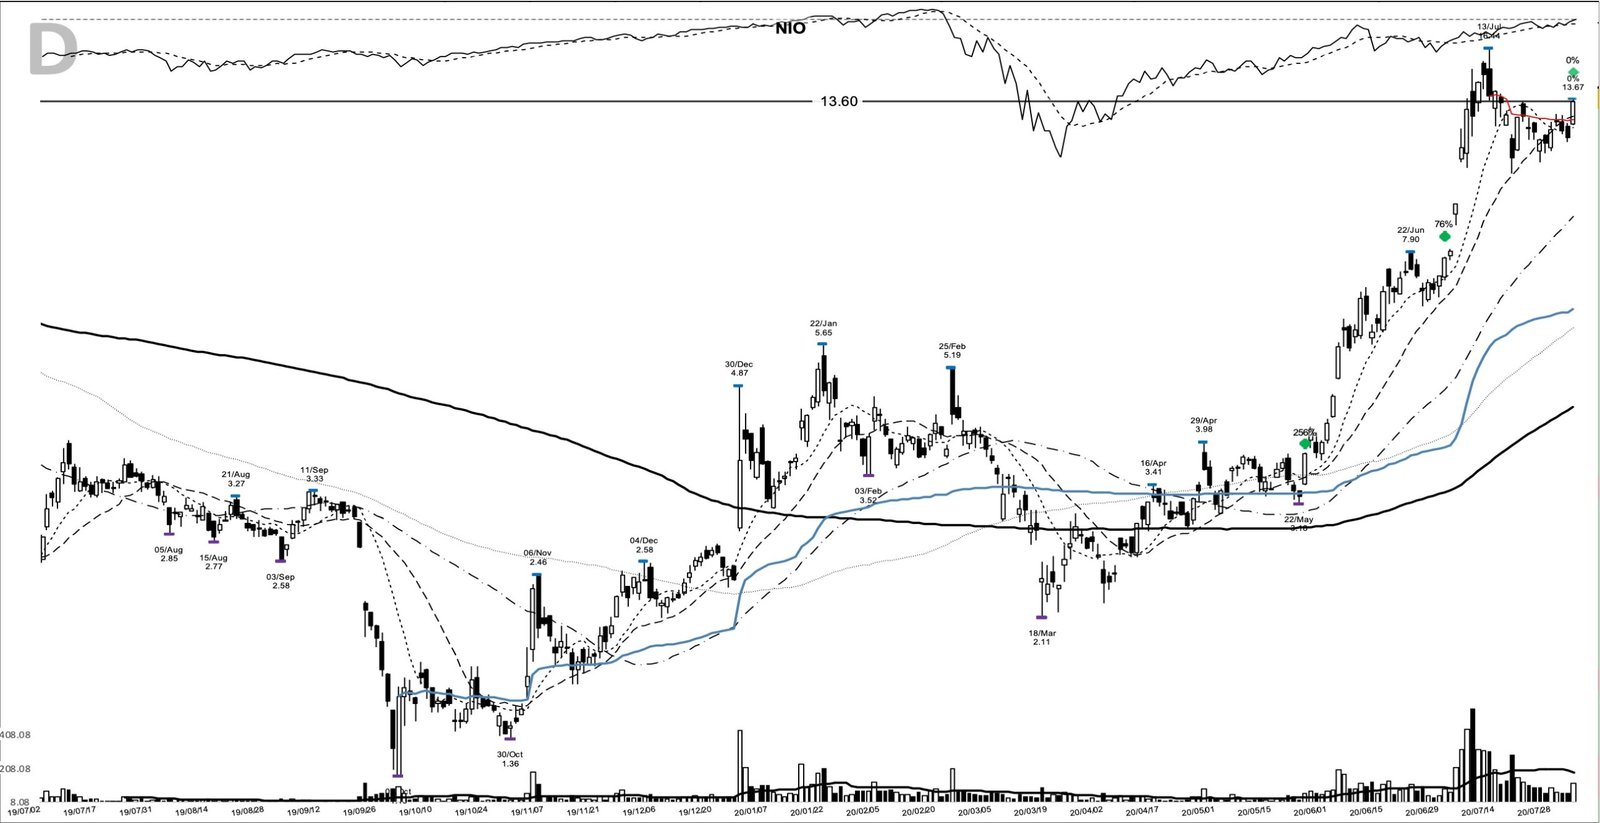
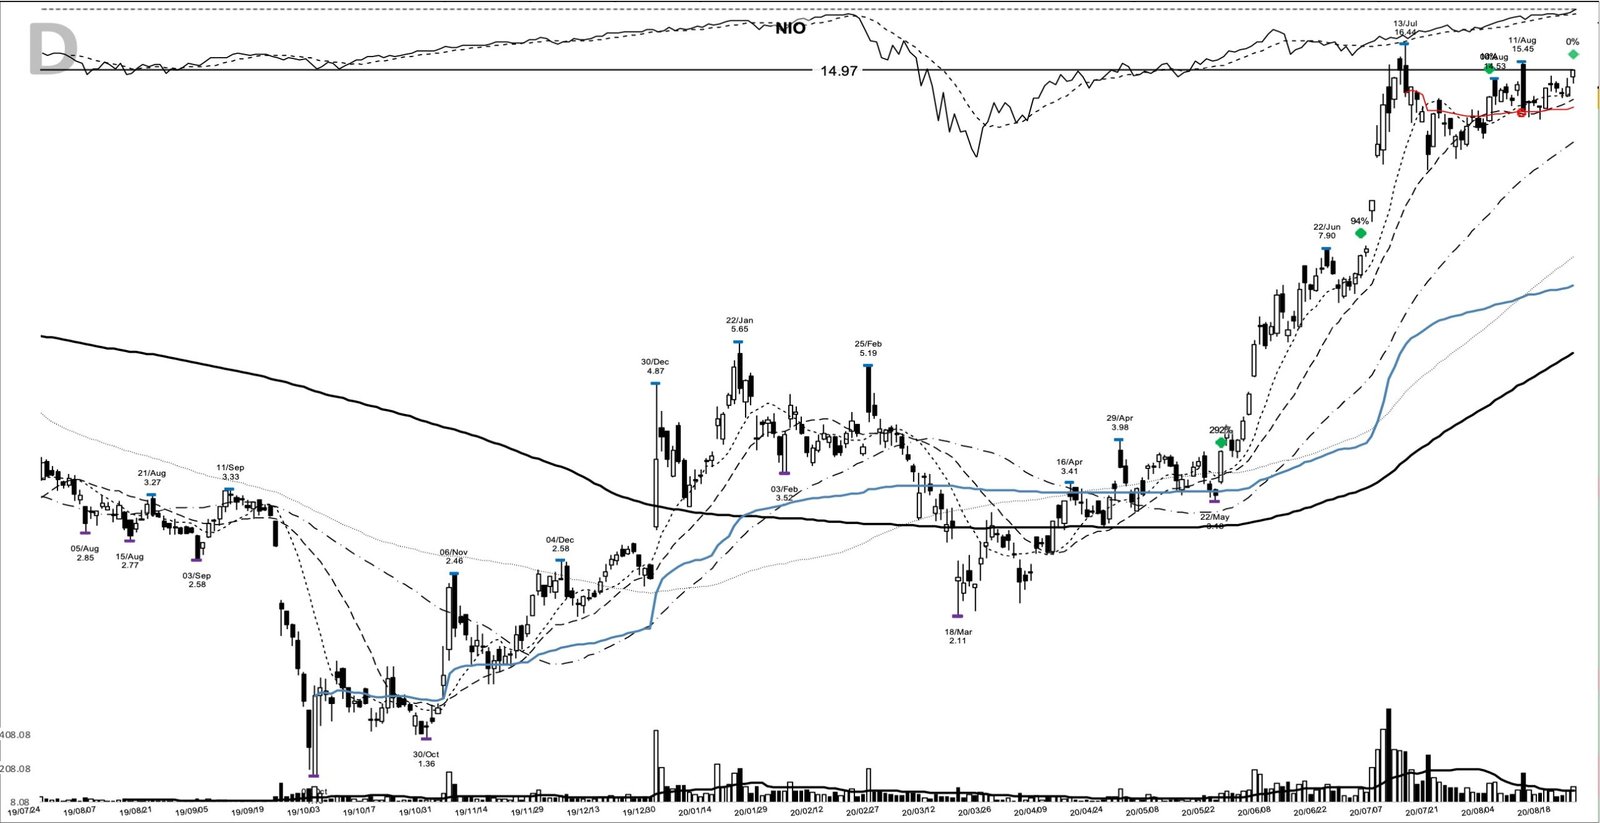
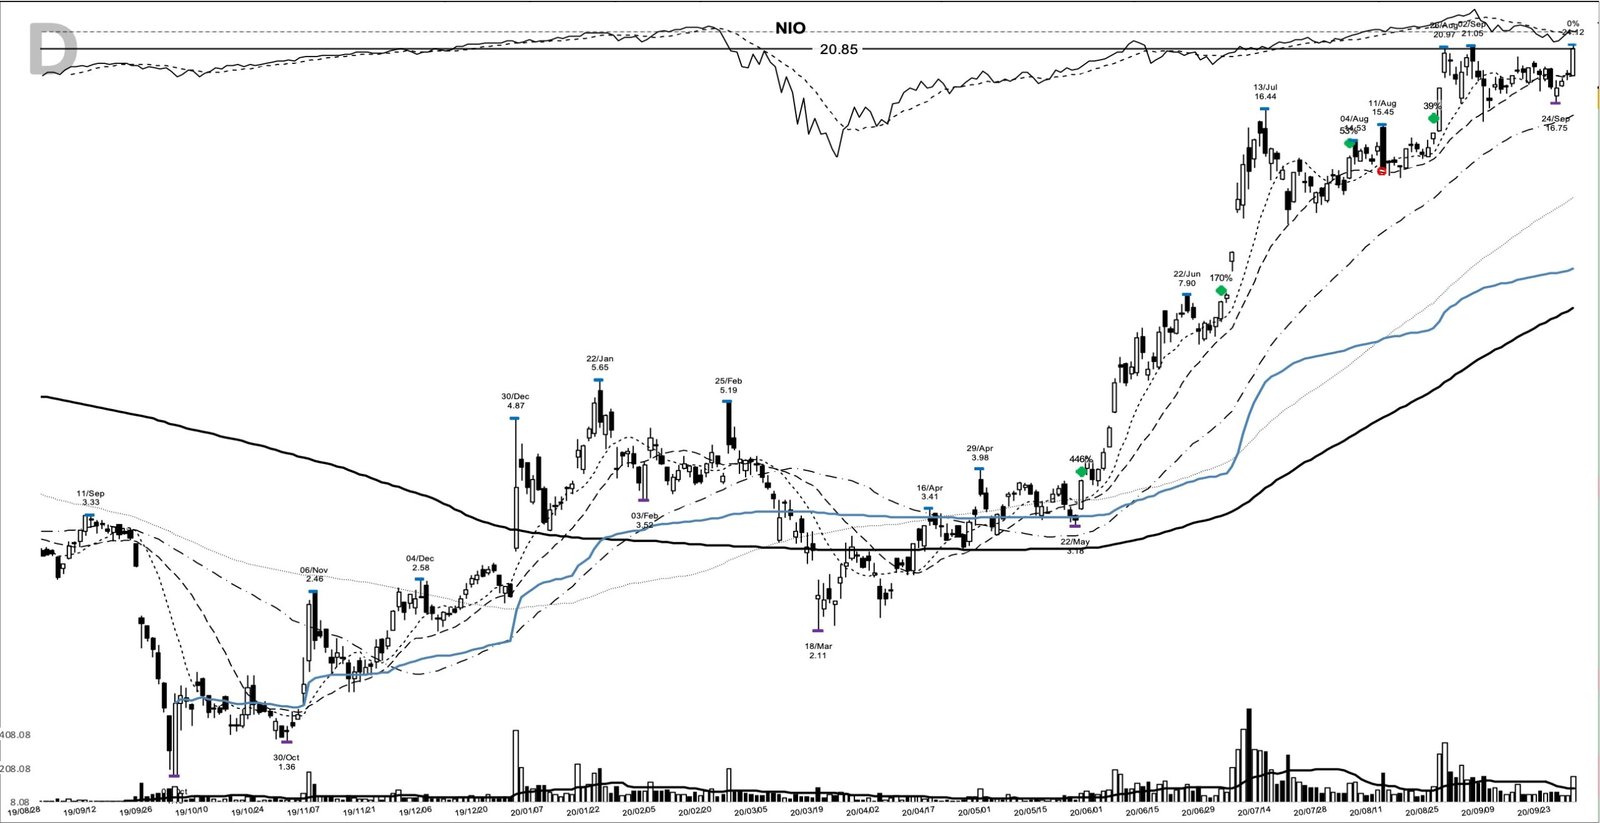
The marked add-on points track the trend. After the first add near 7.72 on 30 June and the second near 13.60 on 3 August, there were further chances to build the position: 14.97 on 24 August, 20.85 on 29 September, 26.50 on 14 October, 31.99 on 29 October, and 48.38 on 30 December 2020. Each add sat above a fresh consolidation, and each carried the same risk as any pyramid, that the last shares bought are the most extended.
Price peaked at 66.99 on 11 January 2021. From there the trend rolled over. The exit close came at 50.68 on 22 February 2021, about a third below the peak but still roughly 1,226.7% above the 3.82 entry, over a 272-day hold. A thousand dollars riding the full move would have become close to 13,300 dollars.
The exit landed in a tape that had turned on names like this one. Late February 2021 brought a violent shakeout across the growth complex, with wide, loose trading where tight advances used to be, and the disciplined response of that moment was to grade holdings and cut the weakest before the market did it anyway. An exit a third below the peak reads harshly only until you weigh what that tape went on to do to the leaders that overstayed.
Where the NIO breakout could have fooled you
This setup came with real traps. The base was very deep, about 67.8% from the 5.65 high to the 1.82 low. Classic base analysis treats a decline that steep as a warning, because most stocks that fall that far never come back. NIO worked because the story changed underneath it, and that’s something the chart alone will never tell you.
The entry itself was early. Buying the 3.82 close meant buying under the 3.98 pivot, before the level had actually cleared. A trader who needed the 3.98 print in hand would have paid up around 4.17 the next day, and that’s the more conservative read of the same trade.
The trend also never moved in a straight line. There were sharp reversals along the way, including a session in mid-November 2020 that ran to 54.20 intraday and closed back near 44.56. Anyone using a tight stop through that noise would have been shaken out well before the 66.99 peak. The pattern promised a level to lean on. It never promised a smooth ride, and it never promised you’d sell the top.
What NIO’s run teaches about riding a leader
The money in a trade like this sits in the holding, not the buying. It’s the part that’s hard to do and easy to skip. The 3.82 entry was the easy part. Everything after it, the adds into strength, the stop that trailed instead of capping, the willingness to give back part of a huge gain rather than sell into the first pullback, is what separated a small win from a life-changing one. A trend follower only needed a level to follow and the patience to let it work. Calling the exact 66.99 top was beside the point.
Learn the pattern. Ride the trend. Keep the gains.
Related studies
No NIO-specific study is on the site yet, so start with the method behind this trade: trend following for the discipline that holds a winner, and Weinstein stage analysis for reading where a base sits in its cycle. A fresh winner study lands most evenings.
Price and volume figures are computed from split-adjusted daily OHLCV data; company figures come from SEC filings where cited.
Educational content only. Not investment advice. Trading involves risk. You are responsible for your decisions.
Get the free Market Wisdom e-book
Join Trends and Breakouts — historical winners, breakout studies, and risk lessons. No spam, unsubscribe anytime.