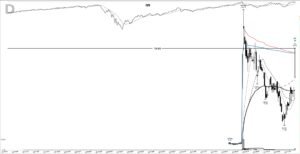
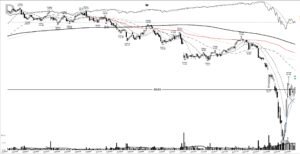
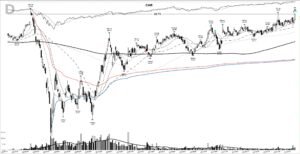
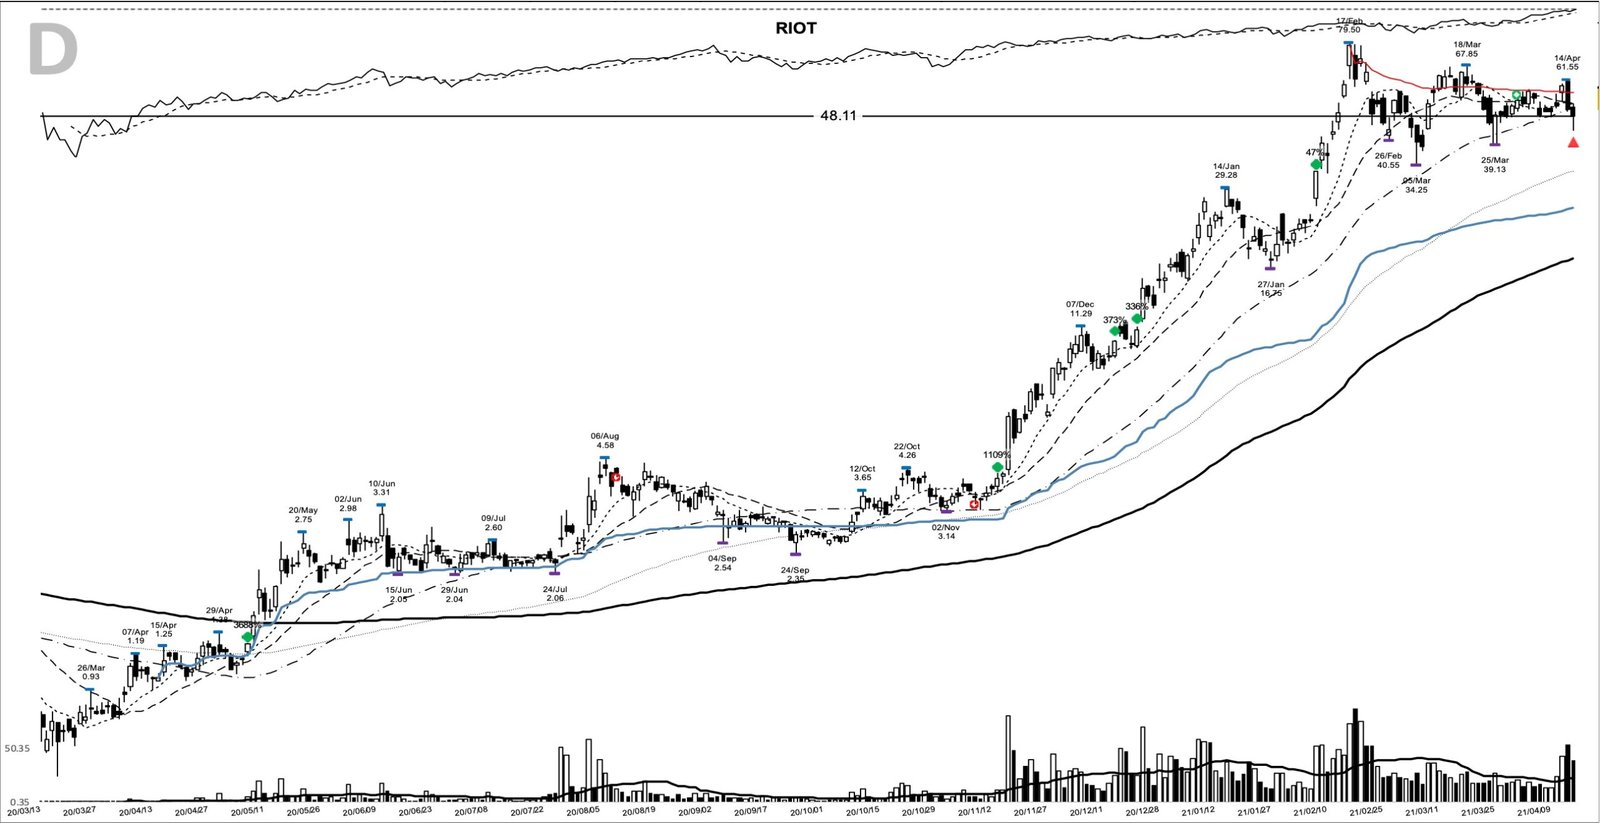
RIOT’s back on traders’ screens this week, ranked number 20 on the Stocktwits most-active list on 13 July 2026, and that’s reason enough to pull up the chart that made its name. Back in the spring of 2020 the stock was a beaten-down bitcoin miner trading near a dollar, grinding sideways while the rest of the market clawed out of the COVID crash. The RIOT base breakout of 6 May 2020 is one of the cleaner trend-following setups in my study archive: a multi-month base, a 2.5-times-volume push off the lows, and an advance that measured out at +3,688% over 344 calendar days.
What follows is that trade taken apart, marker by marker, so the next time a name like this shows up on a screen you’ll know what a real base breakout looked like before it ran.
Key takeaways from RIOT’s base breakout
- The setup was a multi-month base after the COVID crash, with the study entry marked on 6 May 2020 at a close of $1.27, a dime under the $1.38 pivot.
- The entry bar traded 2.5 times its 20-day average volume, the demand signature that separates a real break from a drift.
- The move ran +3,688% from the $1.27 entry to the $48.11 exit on 15 April 2021, a hold of 344 calendar days.
- The trend offered four points to add as it extended, from $3.98 in November 2020 to $32.79 in February 2021.
- The trend, not the entry price, did the heavy lifting: the chart peaked at $79.50 before the exit was marked.
RIOT at a glance: the May 2020 base breakout
| Measure | Value |
|---|---|
| Ticker | RIOT |
| Study entry date (anticipatory) | 6 May 2020 |
| Entry close | $1.27 |
| Pivot | $1.38 |
| Pivot cleared | 7 May 2020 at a close of $1.54 |
| Volume vs 20-day average | 2.5x |
| Exit date | 15 April 2021 |
| Exit close | $48.11 |
| Gain | +3,688.2% |
| Calendar days held | 344 |
| Peak before exit | $79.50 (17 February 2021) |
The chart behind the RIOT base breakout
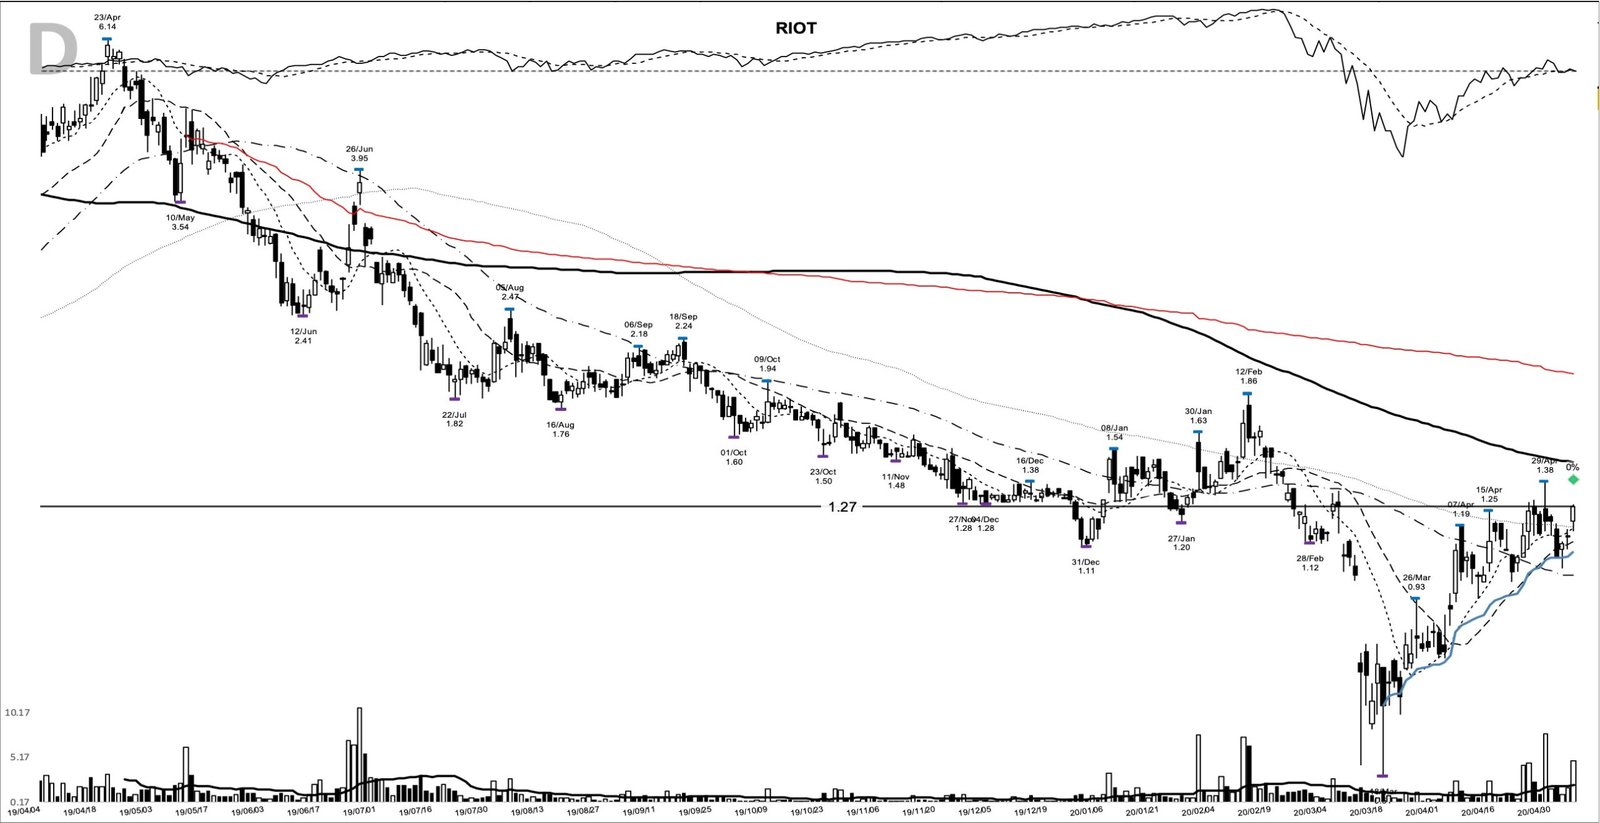
The chart tells a full boom-to-bust-to-base story in one frame. Price bled from the 13 May 2019 high of $4.88 down through more than a year of lower highs, then cratered with the whole market into a $0.51 low on 18 March 2020. The recovery that followed built the base: a tightening range where the 10-, 20- and 50-day moving averages flattened and turned up in order, with the rising short-term average visible under price into early May. The horizontal line at $1.27 on the chart marks the entry, and the $79.50 that came ten months later didn’t fit on the same scale.
Anatomy of the base: how RIOT coiled under 1.38
The base itself ran from the 18 March low of $0.51 to the 12 February high of $1.86, a deep, volatile trough that took roughly six weeks to firm up along its lows. By late April the range had tightened into a shelf, with the five sessions before the break holding a low of $1.03 on 4 May. The resistance to beat, the pivot, was the 20-day high of $1.38 set on 29 April.
On 6 May the stock opened at $1.21, ran to a high of $1.28 and closed at $1.27, pushing 4.79 million shares against a 20-day average near 1.9 million. That 2.5-times-volume expansion is the tell a scanner is built to catch, and it’s what separates a genuine break from an aimless drift. If you study volume confirmation on breakout candles, you’re looking at the textbook version of it.
One honest caveat sits right on the entry bar. The $1.27 close finished the day about a dime under the $1.38 pivot, a push toward resistance rather than a clean break through it. That makes this an anticipatory entry: the marked bar preceded the pivot clearance rather than confirming it. The 7 May session settled the question, trading to $1.59 and closing at $1.54 on even heavier turnover, and that’s where the pivot actually gave way. A trader anchored strictly to a print above $1.38 got the confirmation one day after the volume showed up.
What Riot Blockchain was in May 2020
The company then traded as Riot Blockchain, a small Nasdaq-listed bitcoin miner that had been the biotech outfit Bioptix until an October 2017 rebrand, and would rebrand again to Riot Platforms in 2023. In the spring of 2020 it was tiny and unprofitable. The most recent SEC filing into the entry showed quarterly earnings of about negative 15 cents a share for the period ending March 2020, on revenue near $2.39 million, up 66.9% from a year earlier.
That matters for how you frame the setup. The fundamental case here was thematic, a mining business ramping into an event, with the accounting still deep in the red. The CANSLIM system demands current earnings strength and annual earnings growth. RIOT had neither in May 2020, and William O’Neil‘s checklist would have flagged it at the first screen. The driver was a single, powerful catalyst: bitcoin’s third halving on 11 May 2020 cut the mining block reward from 12.5 to 6.25 coins, five days after the breakout bar.
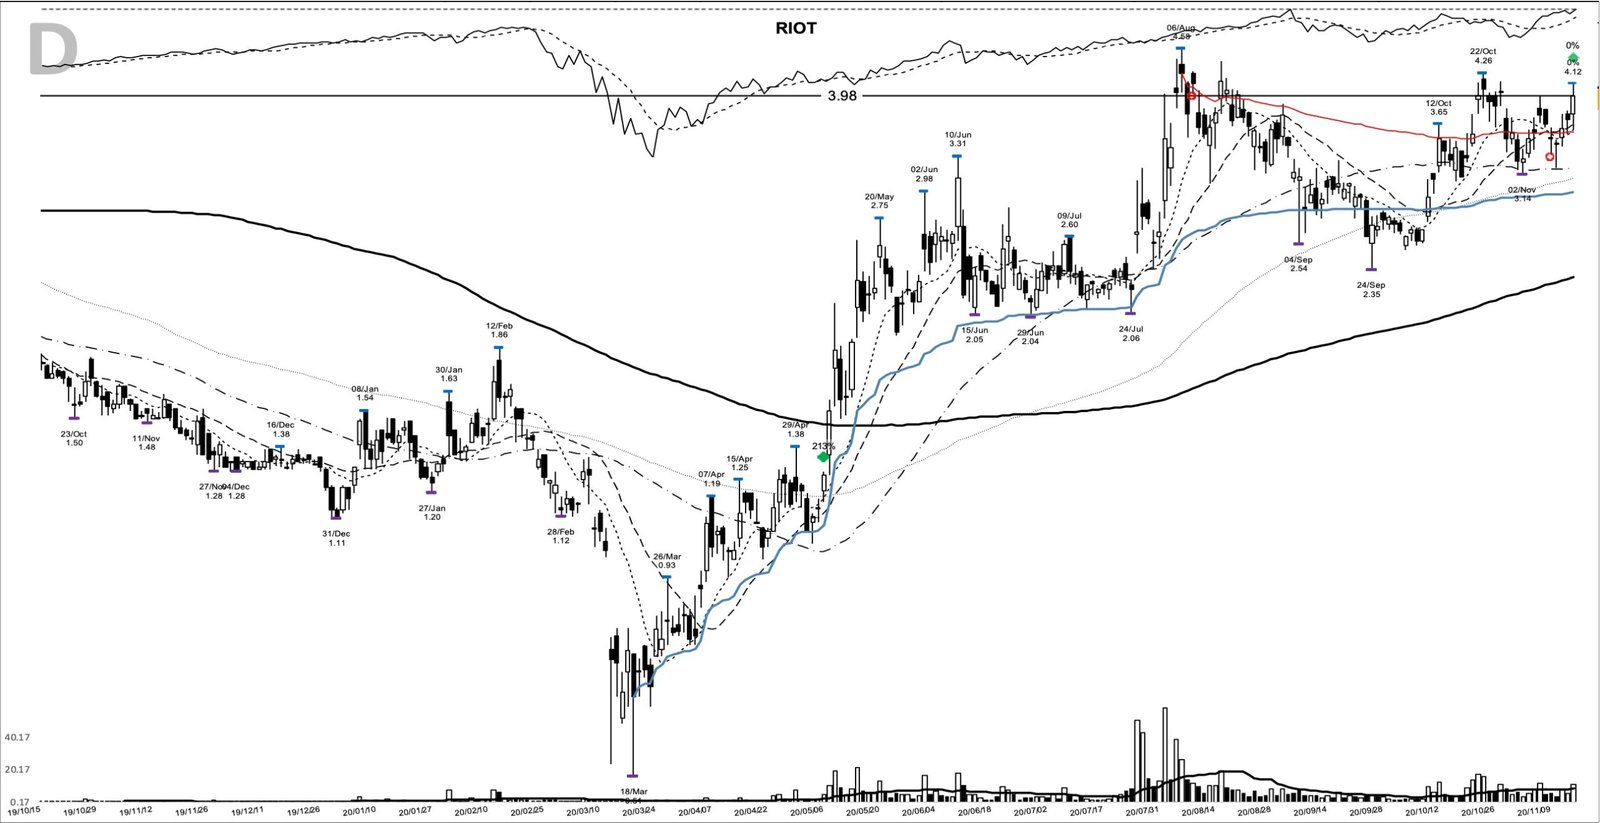
By 13 November 2020 the stock closed at $3.98, already up 213% from the entry, and the chart was building a fresh base a rung higher. On a trend that’s proven itself, a tightening range at a higher level is where a trend follower gets a chance to press the position rather than chase it.
The tape behind the move: bitcoin’s 2020 turn
The backdrop did the rest of the work. Through the second half of 2020 bitcoin turned from a post-crash recovery into a full bull run, pushing toward record highs by December on a wave of institutional buying and a weaker dollar, then extending into the spring of 2021. A leveraged bitcoin proxy like a pure-play miner tends to move several times as hard as the coin itself, up and down. That’s the engine behind a chart that went from $1.27 to a $79.50 peak, and it’s also the reason the ride was as violent as it was rewarding.
The stock market’s spring 2020 recovery mattered as much as the coin’s. By early May the April rebound had been confirmed and fresh breakouts in growth names were holding, even while the gap between a rallying tape and a shut-down economy made most observers uneasy. The honest response to that disconnect was process: predefined entries, losses cut quickly, and winners trailed rather than trusted.
How you could have flagged RIOT before the 1.38 pivot
The setup was catchable in advance, and the structure spells out how. Into the break, price had reclaimed its 10-, 20- and 50-day moving averages, which stood at $1.18, $1.13 and $1.01 and had stacked back into bullish order. The close sat about 7.6% above the 10-day line, close enough to the pivot to act on, far enough above the base to show real demand. That posture, price firming over rising averages inside a tightening range, is the core of Weinstein stage analysis, the transition from a basing stage into an advance.
From that read, a trade plan practically writes itself. A trader using this pattern might have set the trigger just above the $1.38 pivot, with an initial stop below the $1.03 shelf, the level where the immediate base structure would fail. The deeper line in the sand was the $0.51 base low, the point at which the entire setup was wrong. From there the discipline is a trailing one: follow the 10-day moving average while the move is young and volatile, then widen the trail to the 20-day once the advance is well established and you’re ready to give the trend room to breathe.
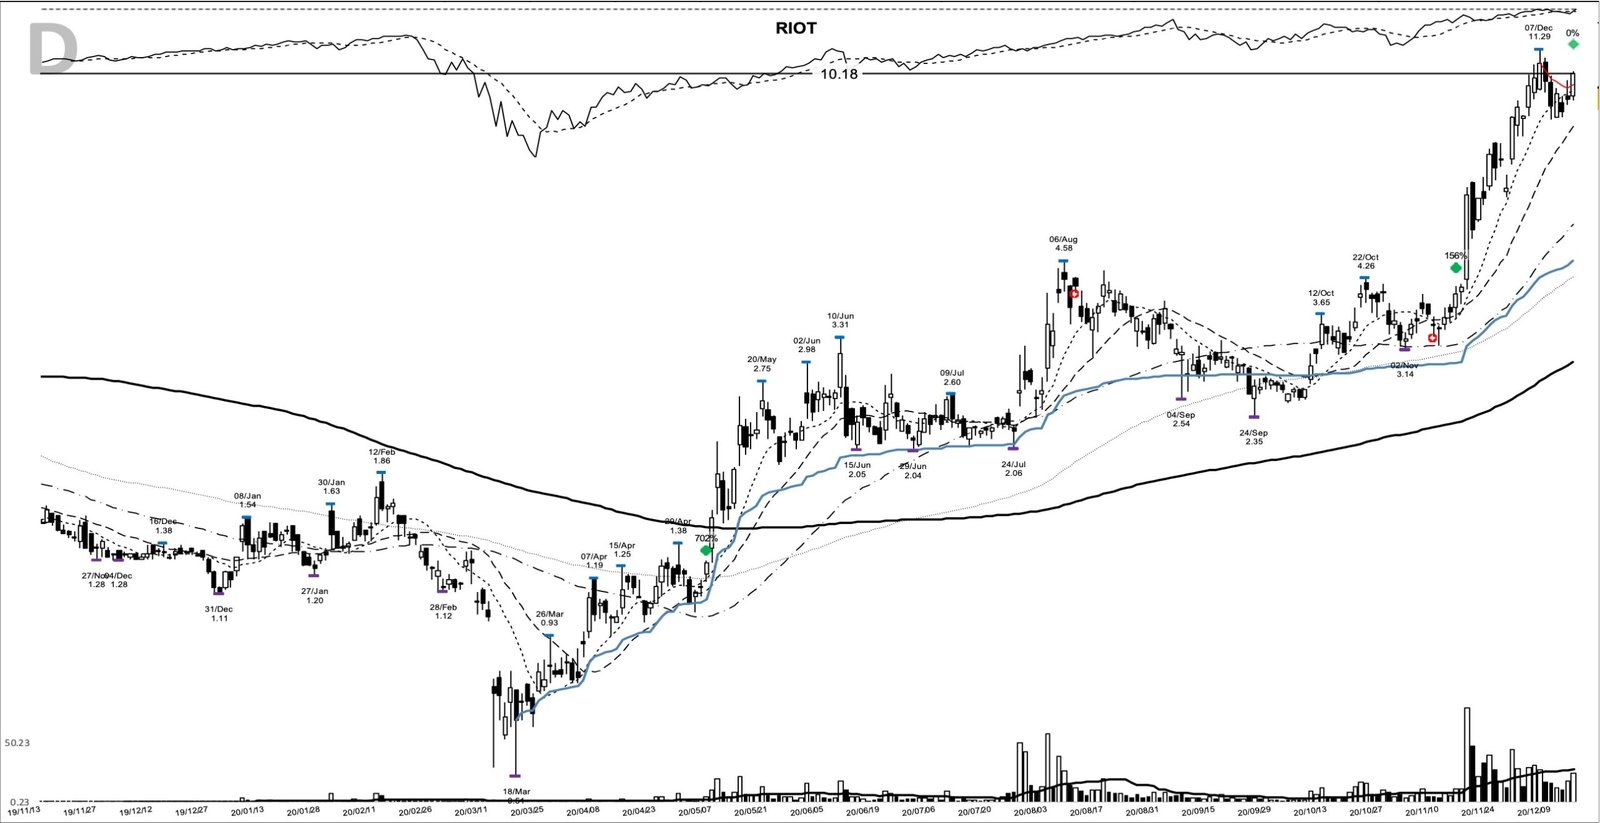
How RIOT’s trend ran from 1.27 to 79.50
A trader following this pattern might have watched the follow-through above $1.38, then let the trend do the talking. It talked for the better part of a year. The move printed four distinct spots where a trend follower could have added into strength: $3.98 on 13 November 2020, $10.18 on 15 December, $11.04 on 21 December, and $32.79 on 8 February 2021, by which point the position sat about 2,482% above the entry.
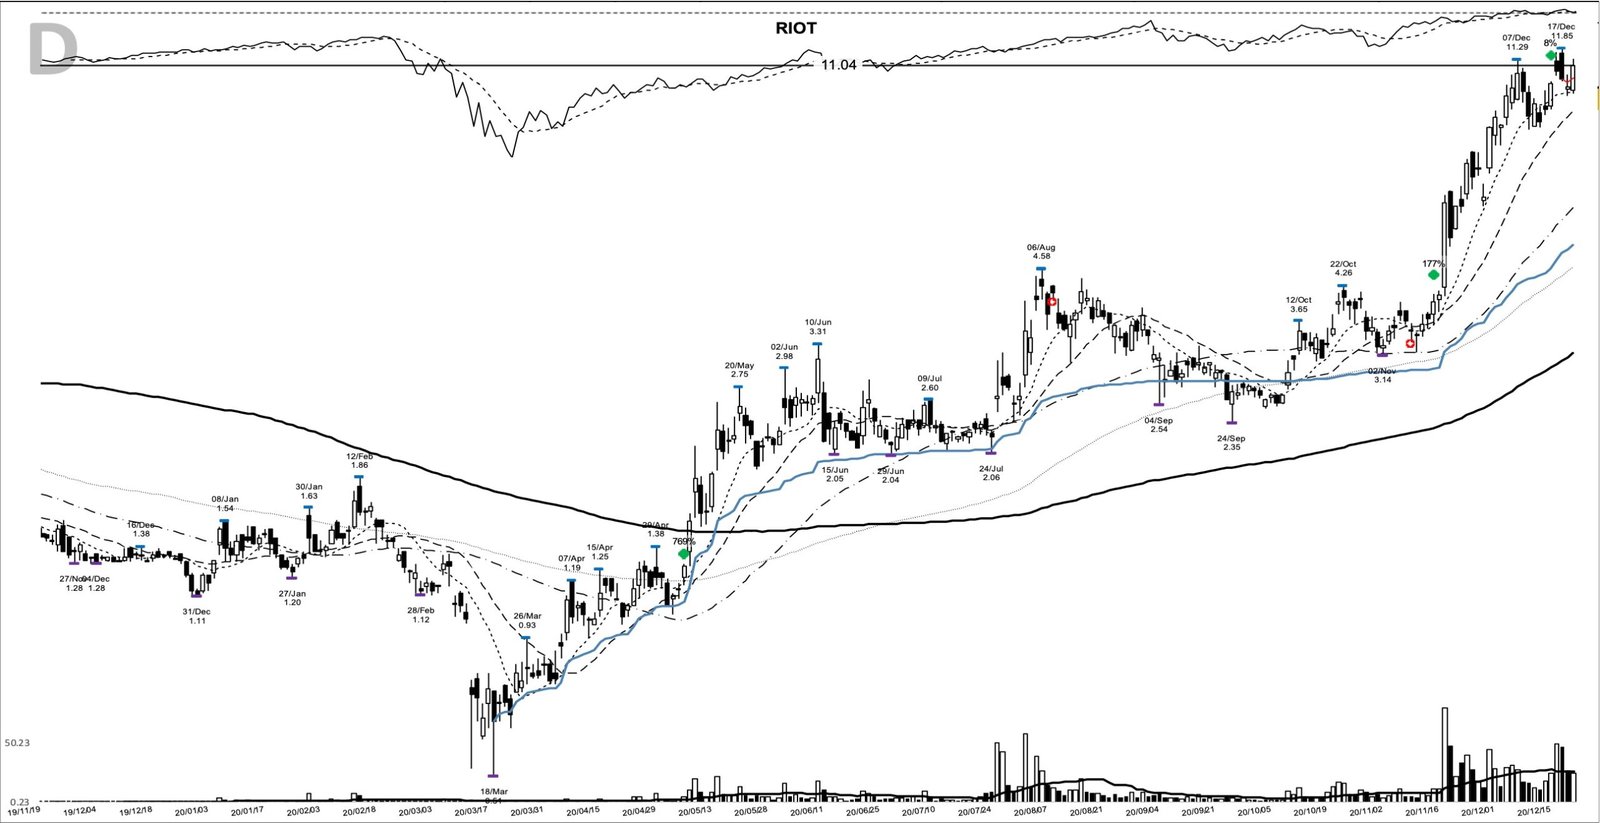
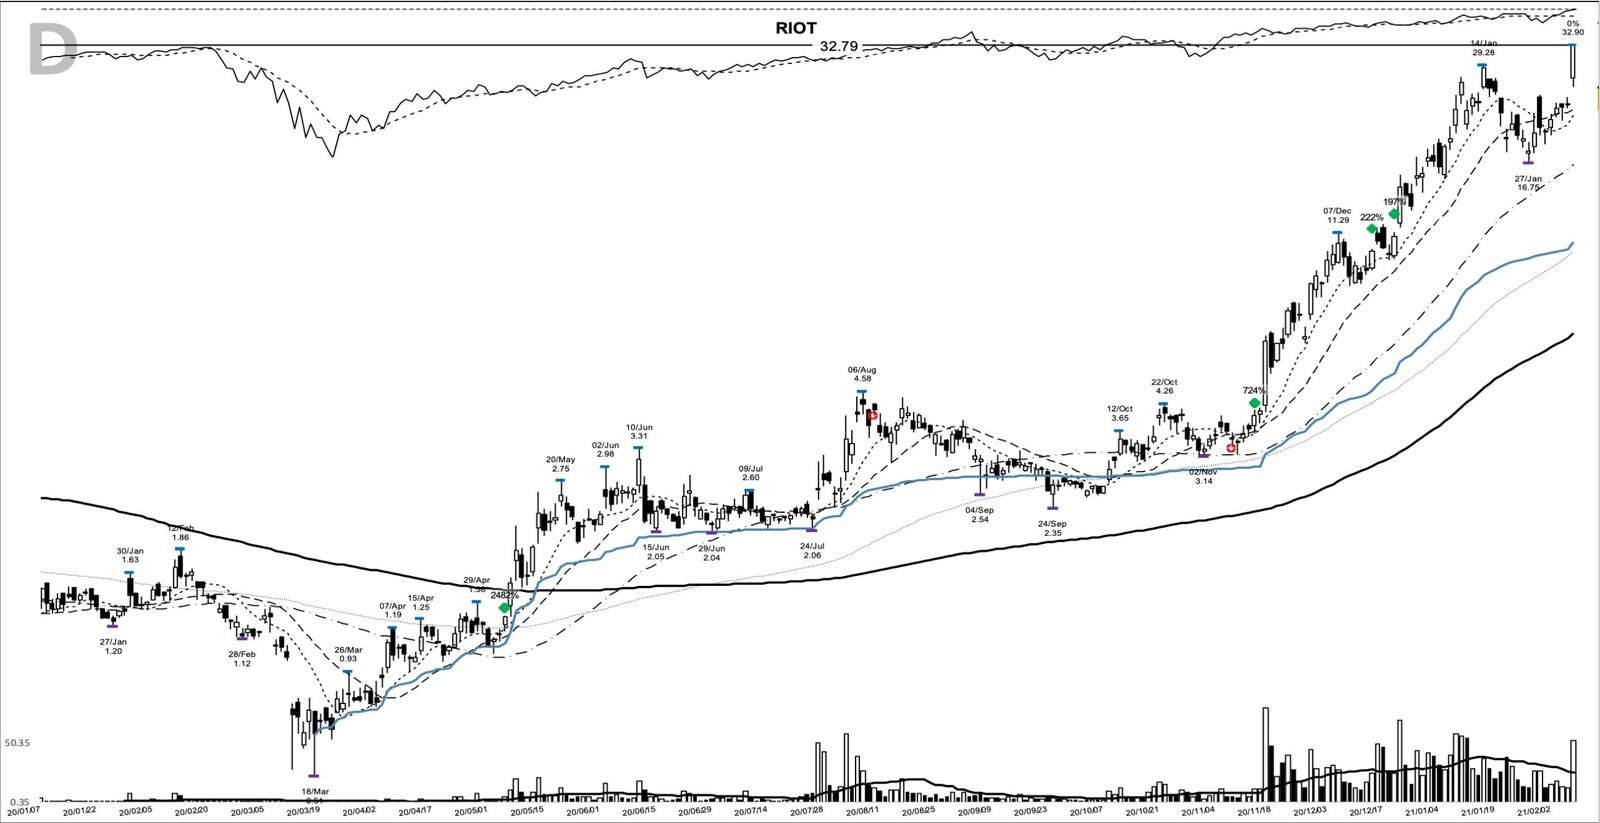
The trend topped at $79.50 on 17 February 2021, then began to break down. The exit was marked at the $48.11 close on 15 April 2021, roughly 40% below that peak but still 3,688% above the entry. On the raw arithmetic, $1,000 committed at the entry and held through the full move would have become about $37,900 by that exit.
The April 2021 tape supported taking the exit seriously. The Nasdaq was testing its prior highs and the headline trend still looked constructive, but the day-to-day signals had turned to churn, alternating strength and weakness with little follow-through either way. In a market that indecisive, a leveraged proxy already 40% off its peak is a broken trend, and the stop is the tool that says so.
Where RIOT’s base breakout could fool you
The clean hindsight arc hides three traps. First, the entry-day close of $1.27 sat under the $1.38 pivot, so buying that close was buying strength ahead of confirmation, and the follow-through the next day is what actually validated the break. Read the wrong way, a base breakout promises a decisive close over the pivot on day one, and this one waited until 7 May to give it.
Second, the fundamentals were thin. A sub-$2 miner losing money is a commodity proxy riding a theme, so the setup carried no earnings cushion if bitcoin had rolled over. The base breakout worked because the halving and the bull run showed up, and you’ve got to be honest that the same chart with no catalyst behind it is a very different bet.
Third, the ride wasn’t anything like the smooth line the monthly view suggests. Between the February add at $32.79 and the $79.50 peak, single sessions swung 20% or more, and the exit came a long way off the top. The pattern offered a trend worth holding and a stop worth trusting, never a top tick. Through all of it the relative strength line led price, and that’s a better tell than any attempt to guess the high.
What RIOT teaches about riding a trend
The number everyone remembers is the 3,688%. The lesson worth keeping is the mechanics under it. The money was made in the holding: a modest position through a base breakout, an initial stop that defined the risk at the $1.03 shelf, and a trailing exit that let a year-long trend run to its own conclusion. Get the entry roughly right and manage the trend, and the arithmetic takes care of itself. Learn the pattern. Ride the trend. Keep the gains.
Related reading, if you want to go deeper on the mechanics behind this study: trend following, the Turtle trading rules, and the CANSLIM system. A new winner study lands most evenings, so check back for the next chart worth taking apart.
Price and volume figures are computed from split-adjusted daily OHLCV data; company figures come from SEC filings where cited.
Educational content only. Not investment advice. Trading involves risk. You are responsible for your decisions.
Get the free Market Wisdom e-book
Join Trends and Breakouts — historical winners, breakout studies, and risk lessons. No spam, unsubscribe anytime.