QS is back near the top of the StockTwits trending list this week, and the chart worth pulling up is one from late 2020, when the same ticker resolved a ten-week base and ran for the rest of the year. The QS base breakout of November 2020 is a clean lesson in following price when the story is loud and the fundamentals are thin. On 13 November 2020 the stock cleared its 15.40 pivot and closed at 19.50 on nearly nine times its average volume, then rode a battery-hype trend to close the year up 333% in 48 calendar days.
The charts here come from my study archive, marked at the buy and sell points a trend follower would have watched. What makes this one useful is that it broke the model-book rule about earnings and won anyway, which tells you which signal was doing the work.
Key takeaways from the QS base breakout
- A deep, ten-week base off the September high resolved on 13 November 2020 with a close of 19.50, clearing the 15.40 pivot on volume 8.9 times the 20-day average.
- The move ran +333.1% from the breakout close to the 31 December exit, a 48-calendar-day hold.
- Price peaked at 132.73 on 22 December 2020 before giving back part of the advance into year-end.
- There was a clear opportunity to add on 17 December 2020, with the trend already well established and volume expanding.
- QuantumScape had no revenue and widening losses at the breakout, so the winning signal was price and volume, not the income statement.
QS at a glance: 13 November to 31 December 2020
| Field | Value |
|---|---|
| Ticker | QS |
| Breakout date | 13 November 2020 |
| Breakout close (entry reference) | 19.50 |
| Volume vs 20-day average | 8.9x |
| Exit date | 31 December 2020 |
| Exit close | 84.45 |
| Gain | +333.1% |
| Calendar days held | 48 |
| Peak before exit | 132.73 (22 December 2020) |
The chart on the day QS cleared 15.40
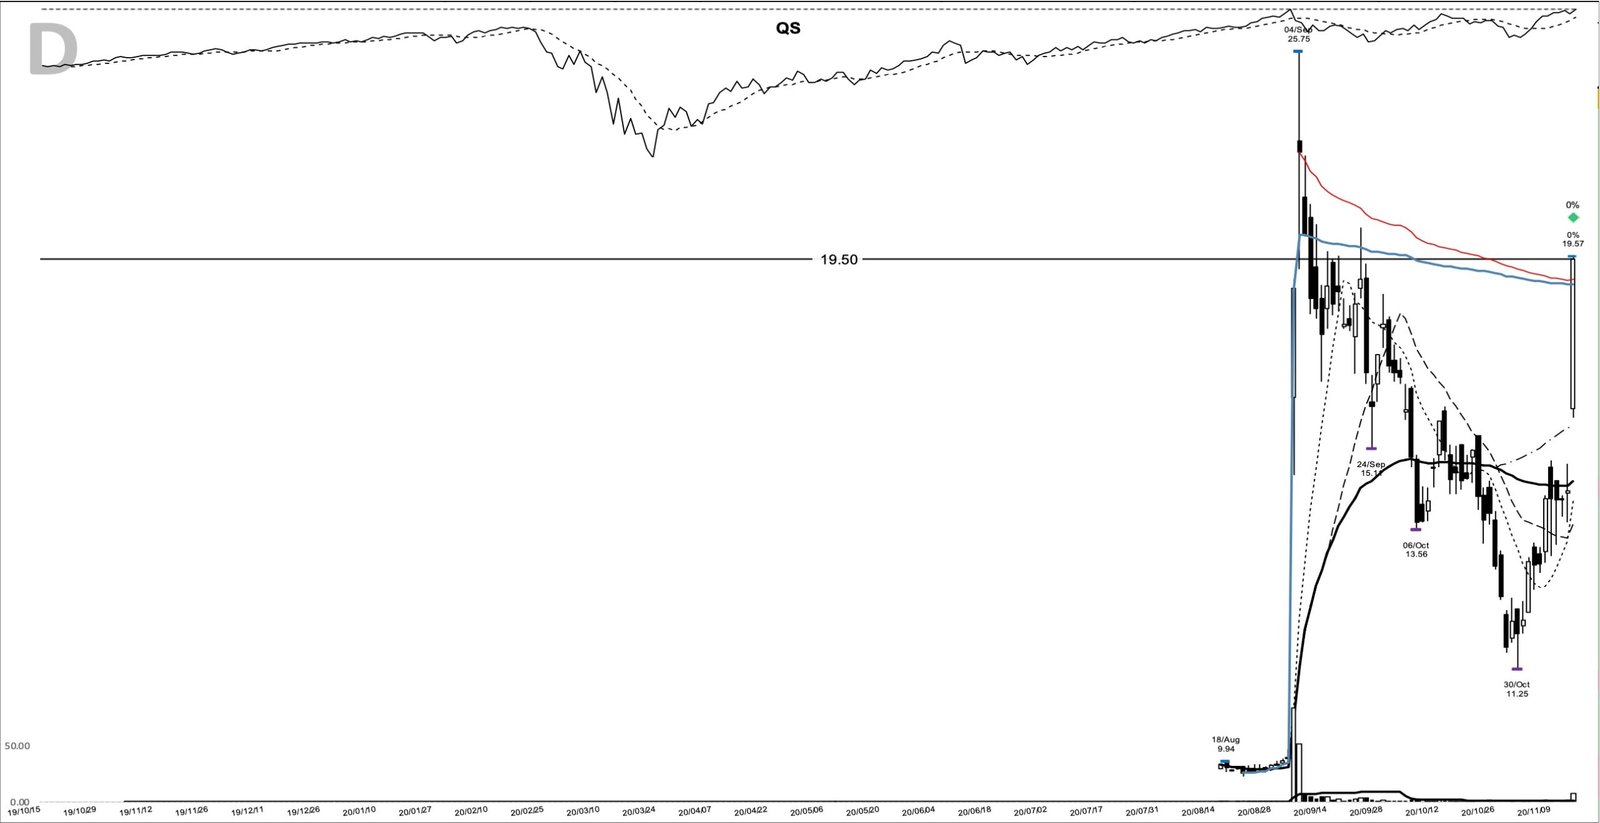
The breakout bar is the tall candle on the right of the chart, printing a high of 19.57 and closing at 19.50, well above everything that came before it in the base. The horizontal line marks that 19.50 close. The volume panel at the bottom shows the single fat bar under it, the tell that separates a real breakout from drift.
How the base built and broke: anatomy of the QS setup
The base started at the September high of 25.75, printed on 4 September 2020, and worked lower for about ten weeks. Price bottomed at 11.25 on 30 October 2020, a drawdown of roughly 56% from that high. That depth matters. A base this loose is not the tight, textbook structure a classic leader carves out, and it returns in the misreads below.
Into early November the stock tightened into a shelf, holding a low of 12.98 on 6 November 2020 and closing in a narrow band just under 14.30. The pivot, the resistance a buyer needed cleared, was the 15.40 high from 21 October 2020. On 13 November the stock opened at 15.95, jumped straight through the pivot, and closed at 19.50 on 7.29 million shares against a 20-day average near 816,000. That is the 8.9x reading, and it is the whole point: demand showed up all at once.
The model-book version of this setup wants earnings and sales accelerating into the breakout. QuantumScape offered the opposite. Reported quarterly EPS ran to a 0.06 loss for the June 2020 quarter and a 1.57 loss for the September 2020 quarter, with no product revenue at all. The base broke out on narrative and money flow, which is exactly why the price and volume signal, not the financials, had to carry the trade.
What QuantumScape was in late 2020
QuantumScape is a solid-state battery developer that reached the public market by merging with Kensington Capital Acquisition Corp, a special-purpose acquisition company. The deal was announced on 3 September 2020, which is the gap on the chart from near 10 up into the low 20s on heavy volume. Through September and October the shares traded as the Kensington SPAC while the base formed under the QS ticker they later carried.
The breakout day has a specific catalyst behind it. On 12 November 2020 the two companies announced that the shareholder vote to approve the combination was set for 25 November. The stock broke out the next session. The vote passed, and QuantumScape began trading under the ticker QS on the NYSE on 27 November 2020, closing near 37 that first day.
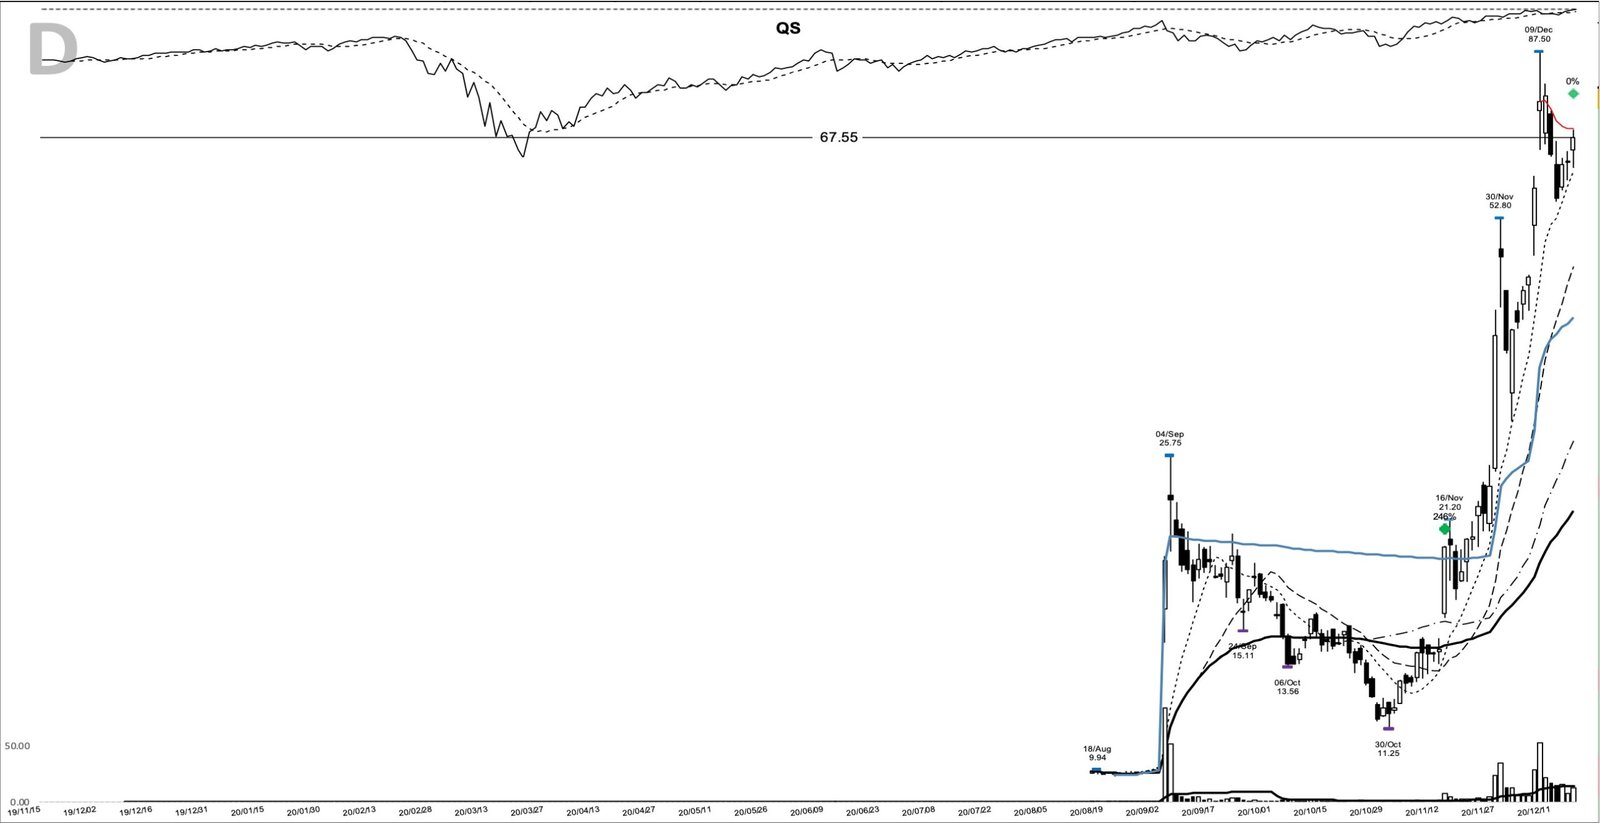
The fundamental catalyst that powered the December leg came on 8 December 2020, when QuantumScape released solid-state battery performance data developed alongside Volkswagen, showing a cell that charged to 80% in about 15 minutes and held above 80% capacity past 800 cycles. The stock gapped from a 44.17 close the day before to 57.90 that session, and the add point on 17 December, at a close of 67.55, sat squarely inside that expansion.
The tape that rewarded QS: late-2020 backdrop
Context helped. Through November and December 2020 the broad market was in a strong uptrend, lifted by the US election result and early COVID vaccine news, and the tape was paying up for speculative growth. Electric-vehicle names and freshly merged SPACs were the loudest corner of that move. A base breakout in a leading theme, in an uptrending market, is the setup with the wind behind it. The same chart in a correcting tape is a very different, much lower-odds bet.
The week of the breakout carried a warning inside the strength. The averages held their uptrend with little distribution on the books, yet growth names had just taken a hit, and the discipline of the moment was to keep exposure only where the stock itself kept confirming. QS clearing its pivot on heavy volume was exactly that kind of confirmation.
Spotting the QS setup before 13 November
By the breakout the trend posture was already constructive. Price had strung together nine straight closes above its 10-day moving average into the pivot, and the shorter averages had turned up under the base: the 10-day sat near 14.13 and the 20-day near 13.67 as the stock coiled beneath 15.40. A watchlist trader had the tell in hand before the move, a stock refusing to break down while it held the 12.98 shelf and pressed the pivot.
The plan a trend follower could have written that day was simple and mechanical: a buy on the break above the 15.40 pivot, an initial stop below the 12.98 shelf, the level that would say the base had failed, and a trailing exit that lets the trade breathe, first the 10-day moving average while the advance is young and fast, then the 20-day once the move is well extended and there is room to give. The rules would have done the deciding, not the headlines.
How the QS trade played out into year-end
A trader using this pattern might have watched for the breakout to hold above the pivot and for volume to stay heavy on up days. Both happened. From the 19.50 breakout close, the stock climbed through the merger completion, gapped on the 8 December battery data, and printed its peak high of 132.73 on 22 December 2020, a maximum gain of about 581% above the breakout close before it ever pulled back.
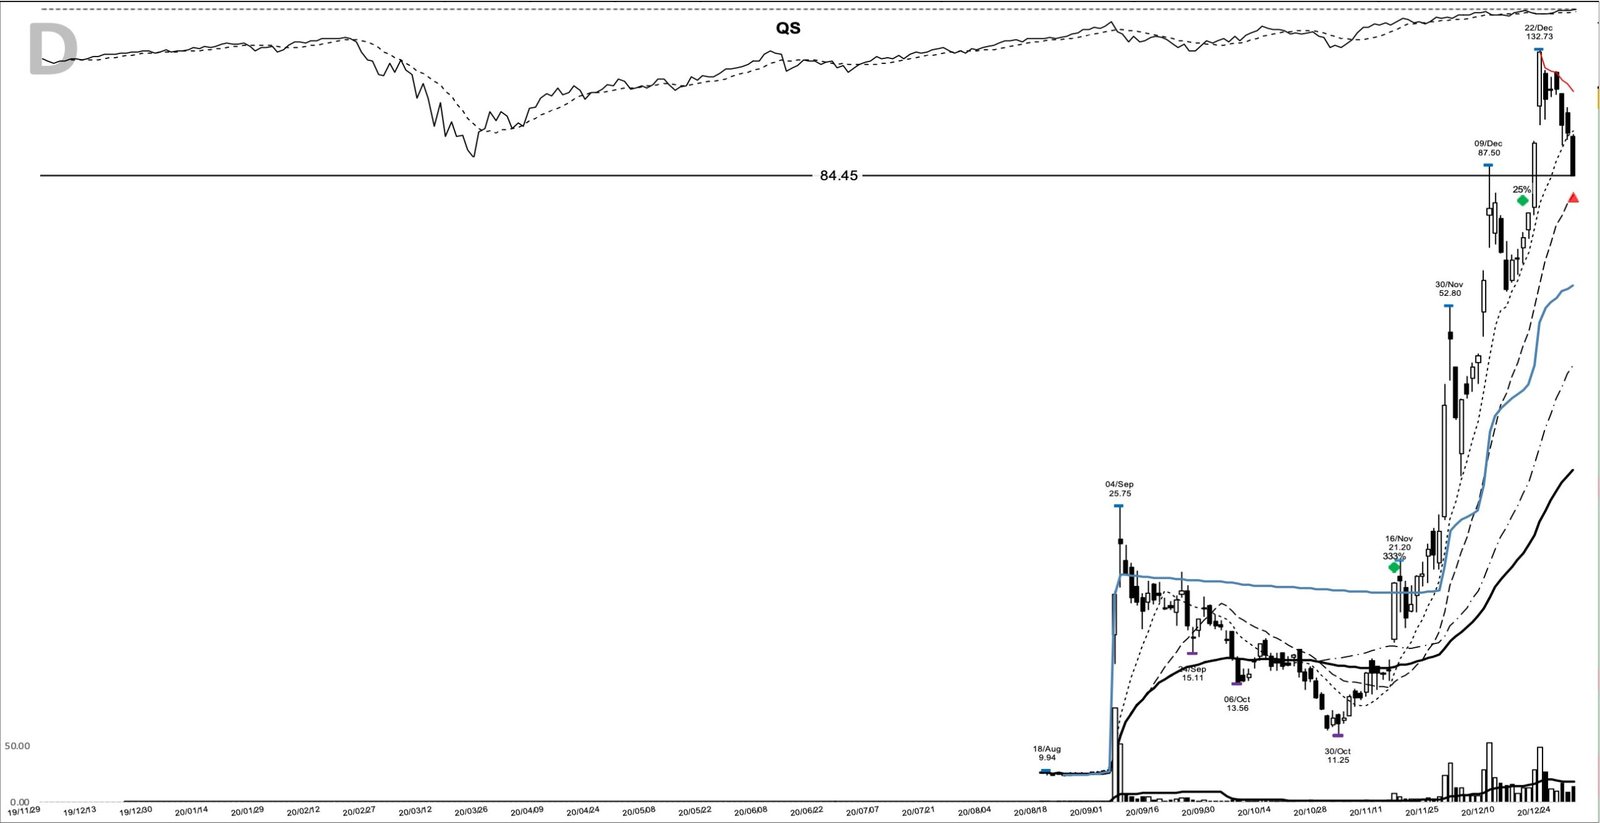
The sell point marked on the chart is 31 December 2020, at a close of 84.45. That is +333.1% from the breakout close over a 48-calendar-day hold. On the conditional math the evidence carries, 1,000 dollars riding the full move from the breakout close to that exit would have become about 4,331 dollars. The exit came off the top, which is the honest cost of trailing rather than trying to sell the exact high of 132.73.
By early January the tape underneath the averages had begun to argue with them. Distribution was collecting, the indexes were diverging from one another, and money was rotating out of the loudest growth themes into duller groups, the sort of environment where an index chart can hide what is happening to a single extended name. Banking the QS move at year-end sat squarely on the right side of that shift.
Where the QS breakout could have fooled you
The first trap is the entry itself. At 19.50 the stock closed about 38% above its 10-day moving average, which is extended. Chasing that far above the line is how traders take a full-size position right before a shakeout, and this chart shook plenty; the stock lost more than a third of its value inside single sessions on the way up. A stop below the 12.98 shelf, not a stop three points under the breakout close, is what let the trade survive that noise.
The second misread is treating the fundamentals as the reason to hold. They were not there. A pre-revenue company with a widening loss does not justify a 333% move on any earnings model, and the same base breakout in a name with no theme and no volume would have failed. The pattern promised a trend to follow with a defined risk point, nothing about a valuation or a guaranteed outcome. When the speculative tape cooled in 2021, QS gave back most of this advance, which is the other half of the lesson.
Learn the base, follow the trend
The QS breakout works as a study because it strips the method down to its load-bearing parts. A defined base, a clean pivot at 15.40, a volume surge on the break, a stop under the shelf, and a trailing exit that let a loud trend run. The earnings were missing and it did not matter, because price and volume were the signal the whole way. Learn the pattern. Ride the trend. Keep the gains.
For the ideas behind this setup, see the notes on trend following, reading volume, and the way a price gap marks demand. The base-breakout lineage runs through William O’Neil and the CANSLIM system, worth reading against a winner that broke the earnings rule. A new winner study lands here most evenings.
Price and volume figures are computed from split-adjusted daily OHLCV data; company figures come from SEC filings where cited.
Educational content only. Not investment advice. Trading involves risk. You are responsible for your decisions.
Get the free Market Wisdom e-book
Join Trends and Breakouts — historical winners, breakout studies, and risk lessons. No spam, unsubscribe anytime.