
Take a hypothetical stock that breaks out of a base at 50.00. A trader buys 100 shares there, the breakout fails four sessions later, and the position is closed at 48.00 for a loss of 200 before costs. About five weeks on, the same stock has built a tighter range just under 51.00 and is pushing through it. A second 100-share position at 51.00, with an illustrative failure level at 49.00, carries another 200 of planned price risk. This is the setting for re-entry after a failed breakout, and the question it raises is narrow: is the chart at 51.00 a new setup with its own evidence, or the old trade wearing a different price?
Those two decisions share a ticker and nothing else. The 200 from the first attempt is realized. It sits in the account history whatever happens next, and the second position can’t reach back and change it. What the second position can do is lose another 200, or more if price gaps.
What re-entry after a failed breakout means
Re-entry here means opening a new position after an earlier position in the same stock was closed because its breakout was invalidated. The first trade is finished. Its loss is booked, and the share count is back to zero before the second decision is made. Two nearby situations are easy to confuse with it, and they carry different risk.
| Situation | Position at the time | What is being decided |
|---|---|---|
| Re-entry after an exit | Flat. The earlier loss is realized. | Whether a new setup has formed, and how much new risk to accept on it. |
| Adding to a losing position | Still holding shares below the entry. | Whether to enlarge an open loss. The original failure level is usually being ignored or moved. |
| Watching a retest while holding | Still holding, usually at a small gain or near breakeven. | Whether a pullback to the old pivot is holding. This is the subject of the breakout retest, where the original thesis is still alive. |
The middle row is the one people slide into without noticing. Someone who never sold at 48.00 and buys more at 47.00 has doubled a position whose stated reason for existing has already failed. The re-entry case only exists because the exit happened first.
Stage one: what the chart showed at the exit
The first hypothetical chart stops on Day 18, the session of the exit. Nothing after that is visible yet, which matches what a trader would actually have known. The base ran for 13 sessions between a low of 46.00 and a high of 49.95, a depth of 7.91%, with the pivot set at 50.00.
Day 14 opened at 49.80, traded through 50.00 and closed at 50.90. Day 15 reached 51.40 and closed at 50.40. Day 16 closed at 49.50, back inside the base. By Day 18 the low touched 47.60 and the 48.00 exit was filled. That sequence is the textbook shape of a failed breakout: a quick push above the pivot, then a close back below it, then follow-through to the downside.
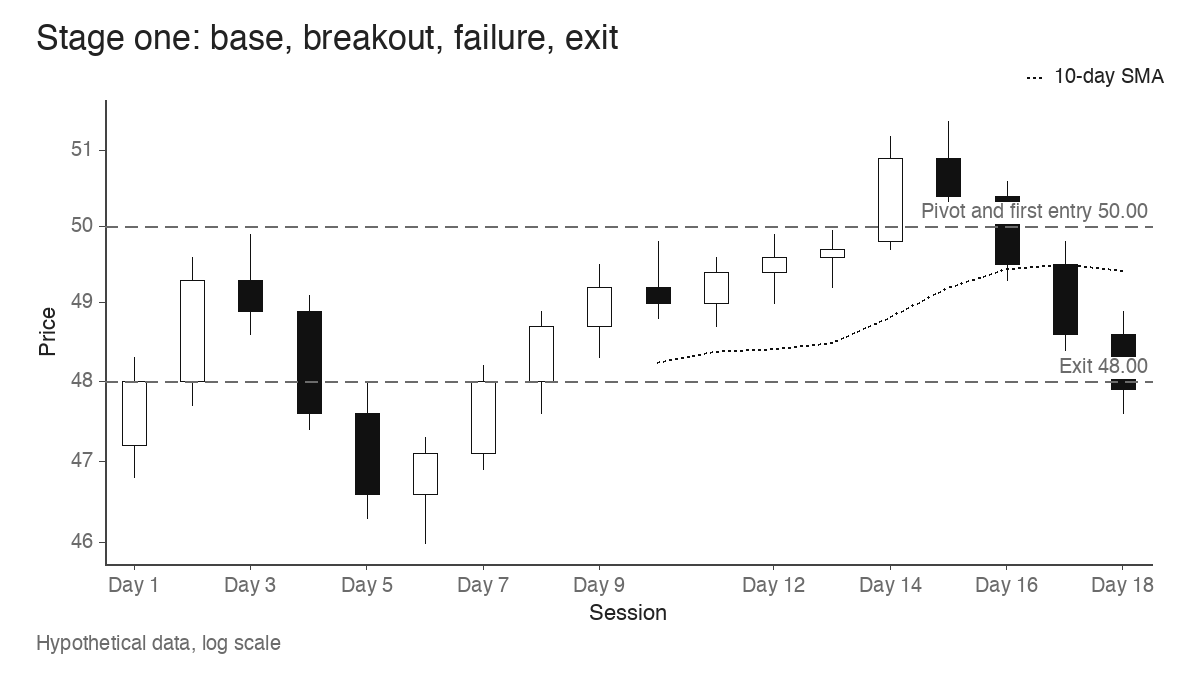
A common misread at this point is to treat the failure as a verdict on the stock. A failed breakout says this attempt, from this base, at this time, didn’t attract enough demand to hold above 50.00. It says little about what the stock will do over the following month. That limited reading is what makes a later, separate setup possible at all.
The rebound toward the old entry price
In the second chart, the stock first fell to 45.50 on Day 22 and then bounced. By Day 25 it had reached 49.90, a dime below the original purchase price. For anyone still thinking about the 200 loss, this is the most tempting moment in the whole sequence. Price is almost back where the trade started, and it feels like the original idea was right after all.
The chart offered very little at 49.90. The bounce came straight off a low with no consolidation, and it stalled under the same 50.00 pivot that had just failed. The next two sessions closed at 48.00 and 46.90. What made the level feel significant was the trader’s own cost basis, which the market has no knowledge of. An old entry price is a fact about one account, and supply and demand in the stock take no account of it.
Stage two: a rebuilt base and a new decision point
After the fade, the structure changed. Day 29 set a new low at 45.40, below the first base’s 46.00 floor. Measured from the failed breakout’s high of 51.40, the new correction was 11.67% deep. From there the stock climbed, closed back above the old pivot at 50.10 on Day 34, and spent Days 37 to 41 in a range from 49.50 to 50.95. That’s a band of 2.85%, far tighter than anything in the first base. A new pivot sits at 51.00, and Day 42 traded through it to 51.60.
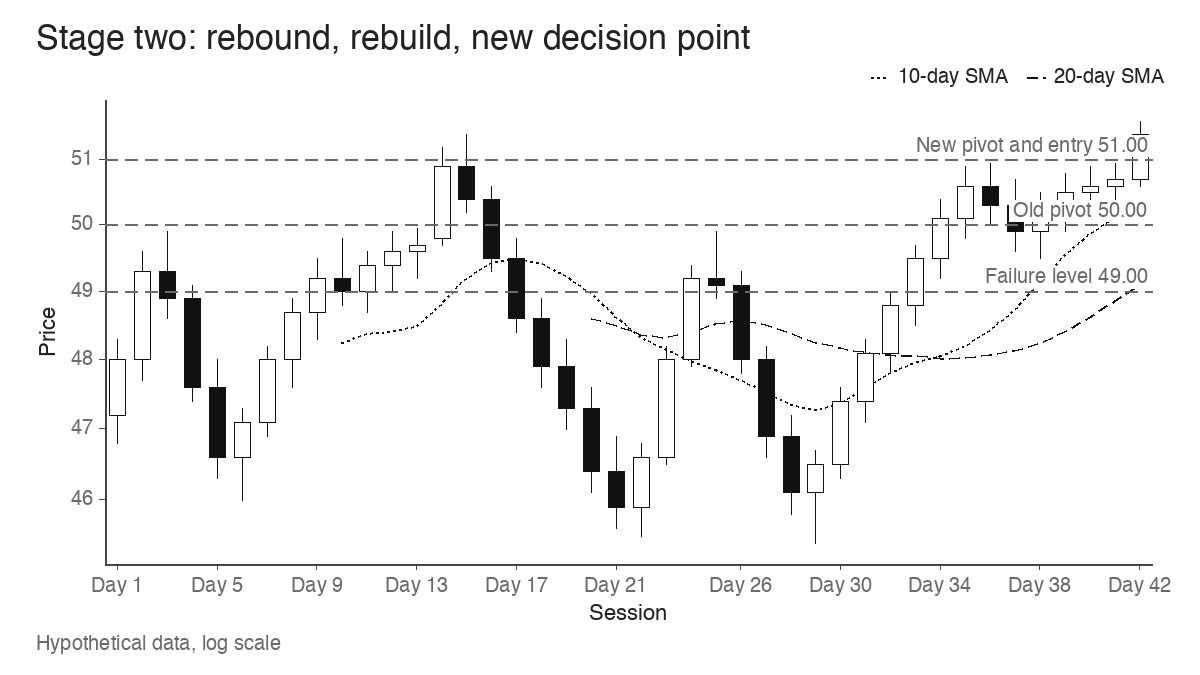
Several things are different from stage one. There’s a fresh low that sellers had a chance to press and didn’t extend. The old pivot at 50.00 was reclaimed and then held through five sessions of quiet trading, with the lowest low at 49.50. The new risk point at 49.00 is defined by that tight action, not by the first trade’s history. What these changes do is make the setup easier to define. That is a smaller claim than calling 51.00 an entry signal, and the chart supports only the smaller one.
Evidence the second setup has to supply
Price structure is only one input. The same questions that apply to any breakout apply here, and they’re answered by the current chart and the current market, without reference to the earlier loss.
| Question | Evidence that would answer it | What would weaken the case |
|---|---|---|
| Has the price structure actually changed? | A new low, a new consolidation, a reclaimed pivot followed by tight closes | A straight rebound into the old pivot with no pause |
| Is demand showing up on volume? | Volume drying up inside the tight range, then expanding on the move through the new pivot | A push through 51.00 on volume below the recent average |
| Is the stock leading? | A relative strength line at or near its high ahead of price | An RS line still falling from the first failure |
| What is the market doing? | Major indexes in a confirmed uptrend, fewer distribution days than during the first attempt | The same weak tape that sank the first breakout |
Read the table as a set of questions. It doesn’t add up to a score, and there’s no count of rows that turns a chart into an entry. A trader using this pattern might find that the first failure was mostly a market problem, with the stock holding up well, and that a better market is the main thing that changed. Another might see a better-looking base in a market that is still deteriorating. Those are different situations, and the table only helps separate them.
The textbook view can also be too generous here. A rebuilt base looks constructive partly because the trader has been watching the stock closely since the exit. Familiarity raises confidence without adding any evidence.
The cumulative-loss arithmetic
The numbers are deliberately simple, and the equal share counts are an arithmetic convenience. They are not a sizing recommendation, and position sizing methods could produce a different count for the second trade.
| Step | Calculation | Result before costs |
|---|---|---|
| First trade, realized | (50.00 – 48.00) x 100 | -200, a 4.00% move against the position |
| Second trade, planned risk | (51.00 – 49.00) x 100 | -200, a 3.92% move against the position |
| Both fail at their levels | 200 + 200 | -400 |
| Second trade gaps to 47.50 | (51.00 – 47.50) x 100, plus the first 200 | -350 on the second trade, -550 combined |
The gap row matters because a failure level is a plan, not a guarantee of the fill. An overnight gap through 49.00 to 47.50 turns 200 of planned risk into 350 of actual loss. A trader working with a maximum loss rule on each position, the kind of loss-cutting discipline William O’Neil applied to breakout buying, might still exceed the intended combined figure through gaps alone.
There’s a second piece of arithmetic worth seeing. To earn back the first 200 on 100 shares bought at 51.00, the stock has to reach 53.00, a 3.92% rise. That number is easy to fixate on, and it’s irrelevant to whether 51.00 is a sound entry. A setup worth taking has a reason to work that has nothing to do with 53.00. A setup taken because 53.00 would make the record whole is a recovery trade, and the chart didn’t ask for it.
Separating fresh evidence from the urge to recover
A journal is the practical tool for keeping the two decisions apart, because it records the reasoning before the outcome is known. A trade journal design that handles re-entries well might give the second trade its own entry, with fields that force the distinction:
- What is new on the chart since the exit, stated with levels (in the example: the 45.40 low, the reclaim at 50.10, the 49.50 to 50.95 range).
- What is unchanged from the failed attempt, including the market backdrop.
- The planned risk on this trade alone, and the combined figure if it also fails.
- Whether the earlier loss was mentioned anywhere in the reasoning.
That last field is the useful one. If the written case for the trade leans on “it owes me” or “I was right the first time”, the entry is about the old position. Over a run of trades, a journal also shows whether second attempts in the same stock behave differently from first attempts, which is a question only the trader’s own records can answer.
Two endings from Day 42
From the decision point at 51.00, the hypothetical can go two ways. In the first, the move through the new pivot holds, and the position is later closed at 55.00 for a gain of 400. Net of the first loss, the two trades come to plus 200 before costs. The rebuild did its job.
In the second, price slips back into the range, the 49.00 level is hit, and the second trade loses 200. The combined result is minus 400, twice the original loss, on a stock that produced two reasonable-looking setups. Both endings start from the same chart, and nothing visible on Day 42 picks between them.
That is the point to carry away. Rebuilding can make a setup clearer, with a tighter range, a defined pivot and a closer risk point, but a clearer setup can still fail. Each attempt is a fresh risk decision, and repeated attempts in the same name add up to real money before any of them has to be wrong by much.
Learn the pattern. Ride the trend. Keep the gains.
Educational content only. Not investment advice. Trading involves risk. You are responsible for your decisions.
Get the free Market Wisdom e-book
Join Trends and Breakouts — historical winners, breakout studies, and risk lessons. No spam, unsubscribe anytime.