It’s late in a Sunday review. The 34th chart on the list shows a seven-week base, a pivot that sits a little loose, and a quarterly earnings jump that looks strong until you notice it laps a weak prior year. Two hours earlier, a nearly identical chart went to the “needs work” pile after a full check of volume, the relative strength line and market direction. This one goes straight onto the active list, and the volume check never happens. Decision fatigue is one possible explanation for that gap: the idea that a long run of demanding choices may contribute to less consistent decisions later in the run.
The word “may” matters. Decision fatigue is a research concept with competing explanations, and it describes a possibility rather than a diagnosis or a guaranteed depletion mechanism. A breakout trader doesn’t need to settle that scientific debate to use the idea well. What the idea offers is a process question: does the same chart get the same treatment at minute 20 and at minute 140?
What decision fatigue covers, and what it leaves out
Several other states produce similar-looking errors, and lumping them together hides the real cause. The distinctions below are working definitions for a review process, and none of them is a clinical one.
- Sleep deprivation is a lack of rest that predates the session. It affects the first chart as much as the last.
- Ordinary physical tiredness builds with time awake or physical effort, whether or not you made any decisions.
- An emotional reaction to losses follows a specific event, such as a stopped-out position earlier in the week, and tends to push decisions in one direction.
- Overtrading is a pattern of taking more positions than the plan supports. Fatigue might contribute to it, yet it also has other drivers, such as boredom or chasing a recent loss.
These overlap. A trader who slept badly, took a loss on Friday and is now on chart 34 could be dealing with all four at once. The practical point is narrower: if decision fatigue is the explanation, the drift should follow the number and difficulty of choices made in the session rather than the clock or the account balance.
Counting the decisions in one research session
It helps to count the choices, because “a long review” hides how many separate judgements it contains. Take a hypothetical session for a growth-stock breakout process:
- Filter 40 candidates from a screen: 40 keep-or-drop calls.
- Shortlist 12 and run six checks on each: earnings evidence, base quality, pivot location, volume pattern, relative strength and whether the setup meets criteria you defined beforehand. That’s 72 judgements.
- Check market direction at least once, and often again for each sector.
Now add one common habit: comparing every shortlisted name against every other (“is this base better than that one?”). Twelve names produce 66 pairwise comparisons. The session goes from 112 decisions to 178, and 37.1% of the total is comparisons that don’t change whether any single setup meets the criteria. A setup either satisfies the predefined rules or it doesn’t. Ranking it against eleven peers is a separate task, and it can wait for the few names that pass.
The textbook reading that “more analysis is more careful” is too broad here. Extra comparisons add decisions without adding evidence.
The same chart, early and late
Return to the Sunday review, with numbers. Say this Sunday review is longer than the session counted above: it runs all six checks on each of 40 candidates, and the comparison is between the first ten and the last ten, the block that contains the 34th chart. Everything here is hypothetical. That’s 60 possible checks in each block.
- First ten candidates: 58 of 60 checks completed, or 96.7%.
- Last ten candidates: 47 of 60 checks completed, or 78.3%.
The gap is 18.3 percentage points. Inside the late block sits the ambiguous chart from the opening, classified “active” with the volume check skipped, while its early twin was classified “needs work.”
Two things in that example are observable: the omitted checks and the inconsistent classification of two similar charts. One thing is inferred: that fatigue caused them. The late block might also contain easier charts, or the trader might have been interrupted twice, or a sector rotation might have changed how loose pivots read. A careful log keeps the observation and the inference in separate columns, so you can revise the inference without losing the record.
When a changed decision is the right decision
Some inconsistency is the process working as intended. Suppose a stock was marked “needs work” on Saturday because its latest quarter showed earnings growth slowing to 18%. On Monday the company pre-announces a stronger quarter, and the stock closes above its pivot on heavy volume. Upgrading it to the active list is a changed decision with new evidence behind it.
The test is simple to state. Before calling a reversal a lapse, ask what information arrived between the two decisions. If the answer is a new price event, a new earnings figure or a change in market direction, the change belongs to the evidence. If the answer is nothing, and only the hour and the number of charts behind you changed, the reversal is worth recording as a possible consistency problem.
What to record in a trade journal
A trade journal designed around process can carry a few extra fields next to each decision: session length in minutes, number of interruptions, a perceived tiredness score from 1 to 5, and how many required checks were completed. Here is a hypothetical six-session log with 12 required checks per session:
- Session 1: 65 minutes, 1 interruption, tiredness 2, 12 of 12 checks, trade result -1.0R
- Session 2: 80 minutes, 0 interruptions, tiredness 2, 12 of 12 checks, +2.4R
- Session 3: 95 minutes, 2 interruptions, tiredness 3, 11 of 12 checks, -1.0R
- Session 4: 150 minutes, 3 interruptions, tiredness 4, 9 of 12 checks, +1.8R
- Session 5: 170 minutes, 4 interruptions, tiredness 4, 8 of 12 checks, -1.0R
- Session 6: 140 minutes, 2 interruptions, tiredness 3, 10 of 12 checks, -0.6R
Sessions of 120 minutes or less averaged 97.2% rule adherence. Sessions over 120 minutes averaged 75.0%. That is the consistency signal. Notice what the outcome column does with it: session 4 skipped three checks and produced the second-best result, +1.8R, while session 1 completed every check and lost 1.0R. The short sessions totalled +0.4R and the long ones +0.2R, a difference six trades can’t separate from luck. The chart below plots completed checks for each session in order of length.
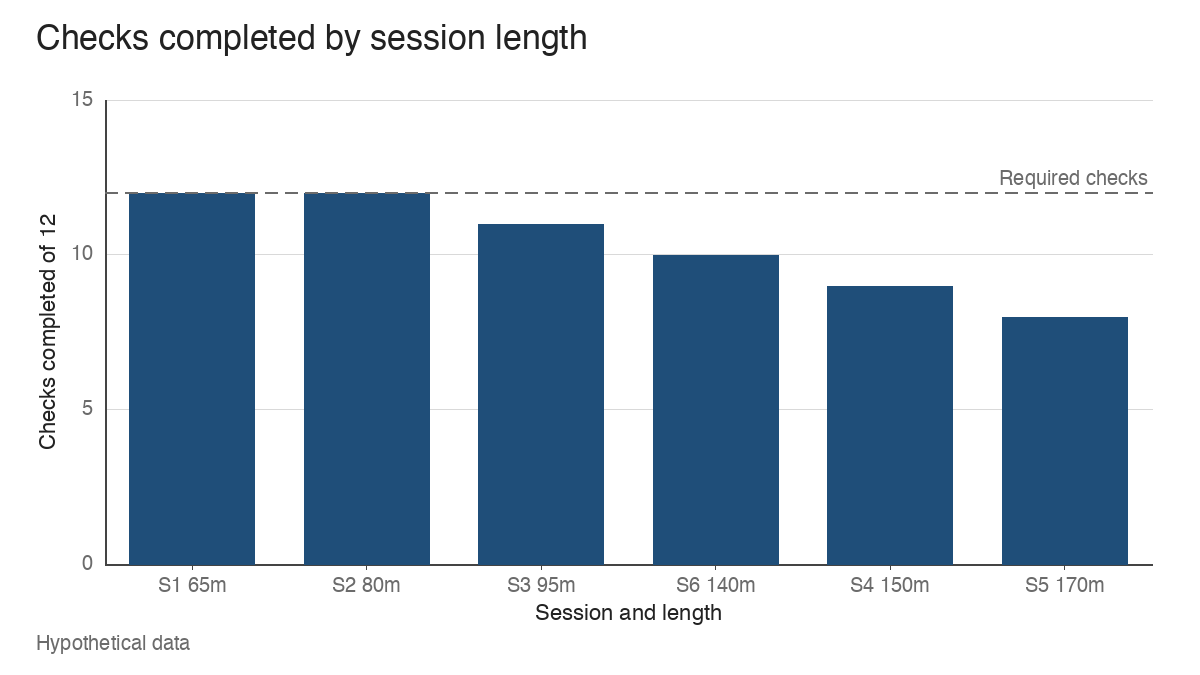
This is why profit or loss doesn’t prove decision quality. A skipped check that happens to work is still a skipped check. The long sessions also carried more interruptions, 3.0 on average against 1.0, so even the adherence gap has two candidate causes in this log.
How existing tools change the number and timing of choices
Several tools already in a breakout process work partly by moving decisions to a better moment or removing them altogether.
A pre-trade checklist converts open-ended judgement into fixed yes-or-no items, which makes an omitted check visible. A tiered watchlist that sorts setups by readiness means only the top tier needs attention during market hours; the rest waits for the next research session. Mental rehearsal of the trade plan settles in advance what a close above the pivot or a failed breakout would mean, so fewer choices are left for the moment price arrives. The growth-stock method described on the William O’Neil Masters page leans on defined criteria for earnings and base structure, which is one way of deciding what counts before the review starts.
Three structural options follow from the session count above:
- Precommitted review boundaries, such as a cap on candidates or a stopping point set before the session, limit how many decisions stack up. The cost is that a strong setup ranked 41st may wait a week.
- Dropping redundant pairwise comparisons cut the hypothetical session from 178 decisions to 112. The cost is losing a relative ranking, which matters when capital is limited to one or two new positions.
- Separating research from time-sensitive evaluation keeps slow, open-ended work away from the minutes when a stock is testing its pivot. The cost is that a setup that forms intraday may get only the quick checks.
None of these implies a right session length or a right number of charts. Those depend on the list, the market and the trader.
Where rigid routines miss new information
A routine built to reduce decisions can also block information. A trader who only re-scores the watchlist on Sundays may miss a Wednesday earnings report that changes a base from “needs work” to “ready.” A hard cap of 12 shortlisted names can exclude a stock that broke out on Thursday with volume that would have put it at the top of the list.
The counterexample from earlier applies in reverse. A process that never changes a decision between sessions has stopped reading the market. Consistency means equal treatment for equal evidence. When the evidence changes, the routine needs a defined way to let it in, such as a short rule for which events trigger a re-review between scheduled sessions.
Limits of decision fatigue as an explanation
A personal log is useful and limited. Six sessions, or sixty, can show that adherence fell in long sessions, but they cannot establish that fatigue caused the fall. Session length rises with interruptions, with harder lists and with market conditions that produce more candidates. Any of those could carry the effect.
The research concept itself is contested. Some work describes a depletion effect; other work attributes similar results to motivation, expectations or task design, and replication attempts have produced mixed results. Treat decision fatigue as one hypothesis among several and use the log to see whether it fits your own pattern of errors.
And it won’t explain every mistake. A losing sequence can come from a weak market, a setup type that stopped working, or ordinary variance across a handful of trades. If every bad week gets filed under “tired,” the log stops being able to tell you anything. The useful question stays narrow: did equal charts get equal checks? If the answer is no, the record shows where the process slipped, and that’s something you can work on. Learn the pattern. Ride the trend. Keep the gains.
Educational content only. Not investment advice. Trading involves risk. You are responsible for your decisions.
Get the free Market Wisdom e-book
Join Trends and Breakouts — historical winners, breakout studies, and risk lessons. No spam, unsubscribe anytime.