
A growth stock has spent seven weeks building a base after a long advance. Three weeks into the base it set a low at $50. The stock bounced, drifted, and then one morning dropped through that low, printing $48 before buyers stepped in. By the following week it was trading back above $50, and the question on the chart is simple to state and hard to answer: has anything changed?
Shakeout plus three is a growth-stock convention for putting a number on that moment. It takes the earlier low the stock undercut, adds three points, and treats that price as a reference level for an early entry inside the base. In this example the level is $53. The arithmetic is short. The reading around it is where the work sits.
The shakeout plus three arithmetic, step by step
The example in this article is hypothetical, built so the numbers stay clean. The convention needs three things in chronological order:
- An identifiable prior low inside the base. Here, $50.
- A later decline that trades below that low. Here, the undercut reaches $48, which is 4% below the earlier low.
- A recovery to a reference price three points above the earlier low: $50 + $3 = $53.
Two lows appear in that sequence, and they do different jobs. The earlier low at $50 is the reference low. It’s the level the market had already marked as a floor, and the convention measures from it. The undercut low at $48 is the event: the moment that floor gave way. It defines how deep the shakeout went, but it isn’t the anchor for the arithmetic.
“Points” here means dollars per share. Three points on a stock with a $50 reference low is $3, which happens to equal 6% of $50. That 6% is a by-product of this particular share price. A reader who converts the convention into “6% above the low” has changed it into something else, and the difference matters once the share price moves away from $50 (more on that later).
The most common arithmetic slip is to measure from the wrong low. Three points above the $48 undercut gives $51, a level that sits only 2% above the earlier $50 low and 6.25% above the undercut. That’s a different trigger. At $51 the stock has barely reclaimed the floor it broke. At $53 it has reclaimed the floor and then travelled another $3, which is 10.42% above the undercut low. The $2 gap between the two levels is the whole point of the convention: it asks for evidence that the recovery has carried some distance beyond the broken level, rather than a bare return to it.
Where the sequence sits inside a base
An undercut and recovery means little without the chart around it. In the hypothetical, the stock rose from $31 to $70 before the base began, an advance of 125.81%. The base then corrected to the $48 undercut, a depth of 31.43% from the $70 high. The $53 reference sits 24.29% below that high, so a stock crossing $53 is still deep inside its base, near the lower third of the structure.
That location tells you what kind of level $53 is. It’s an early reference inside an unfinished pattern, with $17 of overhead price between it and the prior high. Supply from buyers who bought near $70 and want out at breakeven hasn’t been tested yet. The way support and resistance levels form from prior trading applies on both sides here: $50 was support until the undercut, and the zone near $70 is untested resistance.
Context outside the stock’s own price matters as much. A trader reading this sequence would look at the relative strength line against the index through the undercut. If the line held near its highs while price broke $50, the stock was weakening less than the market around it. If the line broke down with price, the undercut fits a stock losing leadership. The broader market condition belongs in the same frame. An undercut during a broad market sell-off, recovered as the indexes stabilise, reads differently from an undercut in a calm, rising market where the stock fell on its own.
What the undercut might mean, and what the chart can’t show
The usual story told about an undercut is that it shakes out weak holders. Stops placed just under an obvious low get triggered, nervous owners sell into the decline, and once that supply is absorbed the stock recovers with fewer sellers left overhead. It’s a coherent story, and the price path in the example is consistent with it.
Consistent is as far as the chart goes. Price and volume data can’t show who sold at $48 or why. A chart doesn’t record stop orders being run, it doesn’t identify institutional accumulation, and it can’t confirm that sellers are exhausted. The same $50 to $48 to $53 path could come from a temporary news reaction, an index rebalancing, or a broad market swing that lifted most stocks for a week. Treating the recovery as proof of a mechanism is the common misread of this convention.
What the chart does show is narrower and still useful. The stock traded below a level many participants were watching, and buyers were willing to pay prices above that level shortly afterwards. Volume can add weight. Heavy volume on the recovery days and lighter volume on the decline to $48 would be a better picture than the reverse. Even then, the reading stays at “demand showed up here”, which is a statement about the tape and not about intentions.
Three ways the sequence can unfold
The convention describes a level. What happens around that level is open, and comparing three paths from the same undercut shows how much remains undecided after the first bounce. All three start from a close of $48.40 on the undercut day.
In Path A, the sustained recovery, closes run $49.30, $50.60, $51.80 and $52.50, then $53.40 on Day 5. The stock keeps closing above $53 afterwards, with its lowest close after the cross at $53.40 and a last close of $55.20, 4.15% above the reference. This is the sequence the convention is built around. What it reveals: the broken floor was reclaimed and price has held a level $3 above it for several sessions. What remains uncertain: whether the base above can absorb the overhead supply near $70, and whether the market cooperates.
In Path B, the brief rebound, the first five closes match Path A. On Day 5 the stock trades as high as $53.60 intraday, 1.13% above the reference, and then closes at $52.70. It never closes above $53 at any point, sliding to $50.20 four sessions later. That last close is 5.28% below the reference and only $0.20 above the earlier low. The intraday touch looked like a trigger and the close said otherwise. The anatomy of a failed breakout applies at a smaller scale: a level is crossed, the crossing doesn’t hold, and the stock returns to the area it came from. The undercut is still on the chart and the stock is back to testing $50.
In Path C, the undercut continues lower. The stock closes at $47.60, $46.90, $47.30 and $46.10, and finishes the sequence at $43.80, 8.75% below the $48 undercut and 12.4% below the earlier low. Here the “shakeout” label was premature. A decline below a prior low that keeps going is a breakdown, and the $53 reference no longer describes anything useful. If the stock later recovers, a reader would have a new low to work from and a new sequence to evaluate.
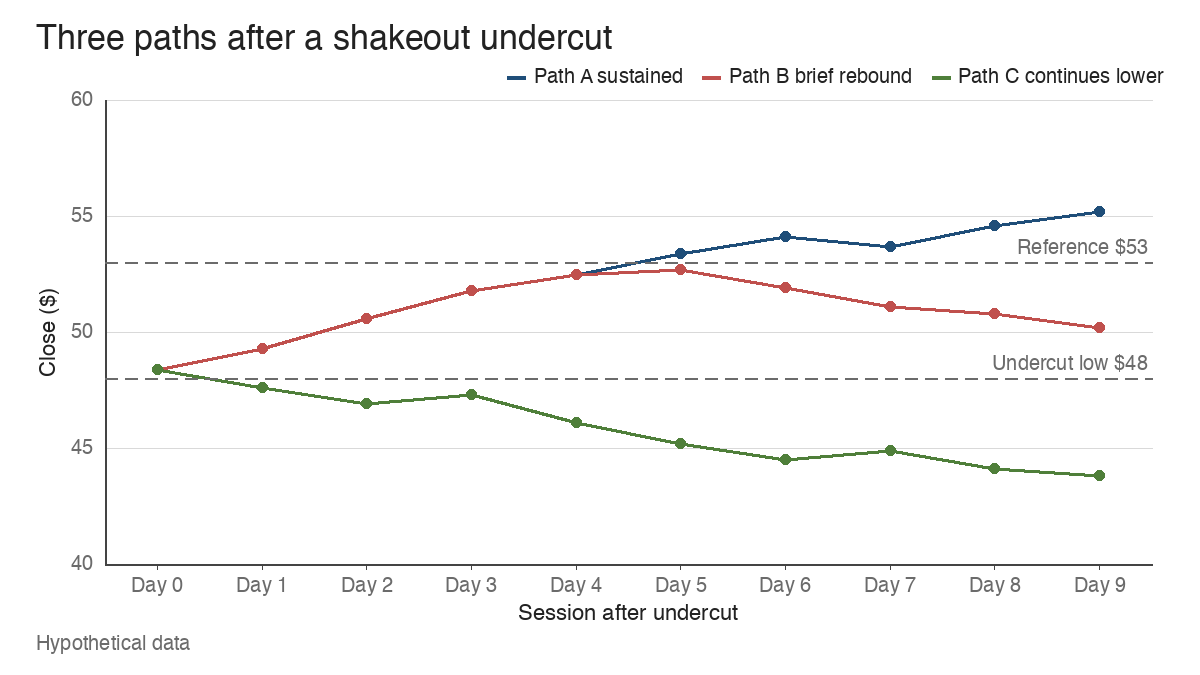
One distance from the example is worth holding on to. The undercut low of $48 sits 9.43% below the $53 reference. A trader using this pattern might note that distance before the trigger is ever reached, because the undercut low is the obvious place the structure would be judged broken, and 9.43% is a wide gap for an early entry. Markets can also gap through any level overnight, so no price on this chart is a guaranteed exit.
How the reference level differs from a breakout pivot
Base analysis in the tradition associated with William O’Neil’s growth-stock work usually puts the main buy point at the top of a completed pattern. In a double bottom, the conventional pivot is the high of the middle peak between the two lows. In the hypothetical, if the bounce after the first low peaked at $62, that midpoint high is the double bottom pivot.
The $53 shakeout reference sits $9 below that pivot. A stock moving from $53 to $62 travels 16.98% before it reaches the level a completed-base reading would use. The two levels answer different questions. The pivot asks whether the stock can clear resistance at the top of a finished structure. The shakeout-plus-three level asks whether the stock has recovered convincingly from a specific undercut, well before the structure is finished.
That difference changes how extension works. Price extension from a breakout pivot is usually measured as a percentage above the pivot, and a stock far above its pivot is considered late. Measured from $53, a stock at $60 might look 13% extended. Measured from the $62 pivot, the same stock hasn’t broken out at all. A reader has to know which level an extension figure refers to, or the number misleads.
The trouble with a fixed three dollars
The convention adds a flat dollar amount, and a flat amount behaves very differently across share prices. Three points is 15% of a $20 reference low, 6% of $50, 2% of $150 and 1% of $300. On a $20 stock the convention asks for a large recovery. On a $300 stock it asks for a move that could happen in the first hour of a quiet session.
Volatility widens the gap further. If the stock’s average true range is $1.50, three points is 2.0 ATR, a meaningful move beyond daily noise. If the average true range is $6, the same $3 is 0.5 ATR, which is well inside an ordinary day’s range. Two stocks with the same $50 reference low can therefore present very different evidence at their $53 levels.
Split-adjusted charts create a quieter problem. Suppose the stock later splits 2-for-1. On the adjusted historical chart, the earlier low becomes $25, the undercut becomes $24 and the original $53 reference becomes $26.50. A reader who applies the convention to the adjusted chart gets $25 + $3 = $28, which corresponds to $56 in pre-split prices. The historical study now uses a level $3 higher than the one that existed at the time. When reviewing old charts, a trader could compute the reference in the prices that were trading then, or express the increment as a percentage of the reference low and state that choice openly. Either way, the $3 stops being a fixed rule and becomes a parameter that needs a reason.
Reading the $53 level as an open question
Shakeout plus three gives a precise number to an imprecise moment, and the precision is useful only when the number is measured from the right low. Start from the earlier low, add three dollars, and then judge the crossing against the base, the relative strength line, the market and the share price the convention was designed around. A close above $53 that holds is evidence of recovery. It says nothing yet about the $62 pivot or the $70 high, and that’s where the rest of the base still has to be built.
Learn the pattern. Ride the trend. Keep the gains.
Educational content only. Not investment advice. Trading involves risk. You are responsible for your decisions.
Get the free Market Wisdom e-book
Join Trends and Breakouts — historical winners, breakout studies, and risk lessons. No spam, unsubscribe anytime.