
A growth stock you’ve followed for months prints a red weekly bar. The close is 99, the prior week closed at 100, and the scan you run on Friday night lists it among the decliners. Open the chart and the bar tells a different story. During the week the stock traded as low as 90, ten percent below the prior close, and then climbed back to finish near the upper part of its range on volume 54% above its 10-week average.
That shape is what chart readers call weekly supporting action: a week that finishes lower but recovers a large share of its own decline, with volume high enough to say that a lot of shares changed hands on the way back. It’s one of the more useful things a weekly chart can show, and one of the easiest to over-read. The recovery is visible. The buyers behind it are not.
Four separate readings of a weekly supporting action bar
The example in this article is hypothetical, built to keep the arithmetic clean. Week A has a previous close of 100, a weekly high of 103, a low of 90 and a close of 99. Volume for the week is 1.85 million shares against a 10-week average of 1.20 million.
Each of the four numbers below answers a different question, and it helps to write them down separately before forming any view.
- Weekly net change: (99 – 100) / 100 = -1.0%. This compares the close with the prior close and nothing else.
- High-low range: 103 – 90 = 13 points, or 13% of the prior close. This measures how far the stock travelled inside the week.
- Closing location: (99 – 90) / 13 = 69.2% of the way up the range. This shows where the week settled relative to its own extremes.
- Volume comparison: 1.85 million / 1.20 million = 1.54 times the 10-week average. This says activity was high and says nothing about direction.
The -1.0% is accurate and badly incomplete. A list sorted by weekly return puts Week A next to a stock that drifted down 1% inside a 2-point range, and those two weeks have almost nothing in common. Net change can’t see the 10% intraweek decline, and it can’t see the 9-point recovery from 90 to 99.
The 69.2% figure carries its own trap. It’s a description of this bar, and it doesn’t qualify anything. A close 60% of the way up a range in a calm market could matter more than a close 75% of the way up after an earnings release, so treating any closing-location number as a pass mark turns a reading aid into a rule the data never earned.
Similar volume, close near the low
Now set Week B beside it. Same prior close of 100, high of 102, low of 90.50, close of 91.20, volume of 1.80 million shares. The calculations come out as follows: net change -8.8%, range 11.5 points, closing location 6.1%, volume 1.50 times the 10-week average.
The volume ratios are almost identical, 1.54 against 1.50. If you only checked whether volume was heavy, the two weeks would look like the same event. What separates them is where the stock finished once all that trading was done. Week A closed 9 points off its low. Week B closed 0.70 above its low, so the selling ran right into the final session and there was no meaningful recovery by the close.
It’s tempting to read Week A as institutions stepping in and Week B as institutions leaving. The chart can’t support either claim. Heavy volume with a recovery shows that buyers were willing to pay higher prices as the week went on. It doesn’t identify who those buyers were, whether they were building positions or covering shorts, or whether the same funds were selling into the bounce. Reading volume against its own average tells you how active the stock was; the price bar tells you who won the week on balance. Neither tells you who the participants were.
What the daily bars hide inside the weekly bar
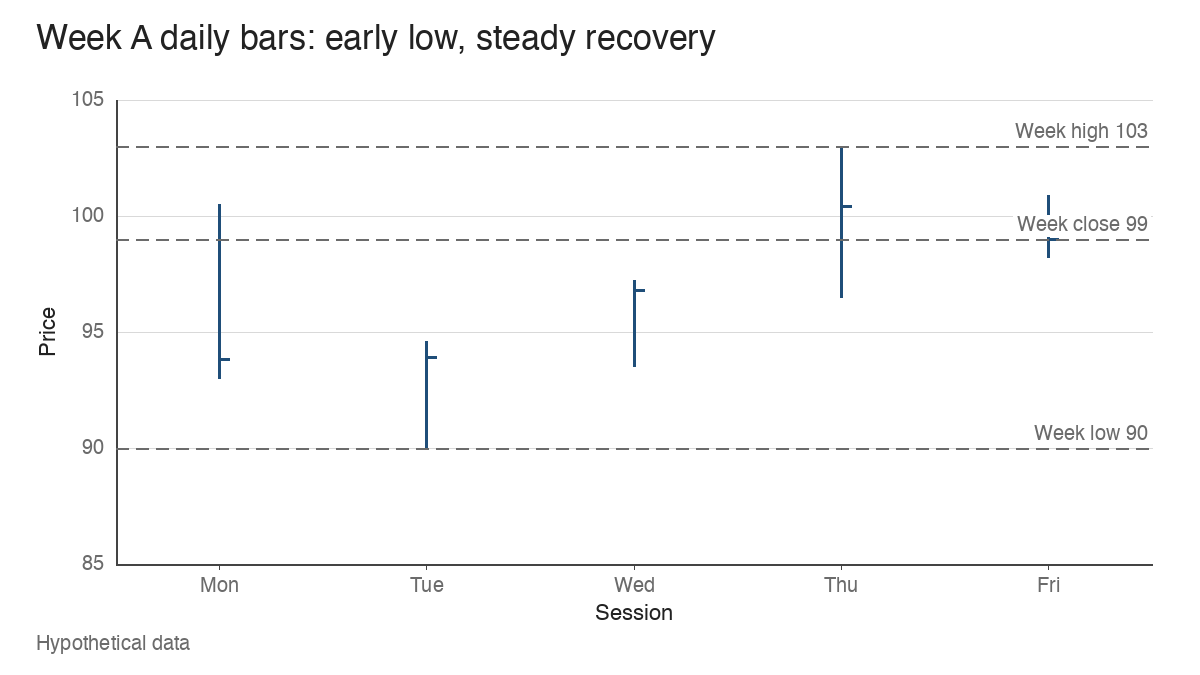
A weekly bar is a summary of five daily bars, and very different weeks can produce the same summary. Here are Week A’s daily components (high, low, close, volume in thousands of shares):
- Monday: 100.50 / 93.00 / 93.80, 420. Down 6.2% on the day.
- Tuesday: 94.60 / 90.00 / 93.90, 560. The week’s low prints, but the session closes 84.8% of the way up its daily range.
- Wednesday: 97.20 / 93.50 / 96.80, 410. Up 3.1%.
- Thursday: 103.00 / 96.50 / 100.40, 300. The week’s high.
- Friday: 100.90 / 98.20 / 99.00, 160. A quiet 1.4% dip on the lightest volume of the week.
Tuesday and Wednesday together carried 52.4% of the week’s volume, and both were recovery sessions. The decline happened early, the turn came on the busiest day, and the week faded only slightly on low activity.
Week A2 has exactly the same weekly bar: high 103, low 90, close 99, volume 1.85 million. Its daily path runs differently. Monday falls to 93.50 and Tuesday tags 90.00 and closes at 92.60. Wednesday and Thursday rally hard, with Thursday closing at 102.60 near the week’s high. Then Friday drops 3.6 points to 99.00, a 3.5% decline that closes 7.1% of the way up its daily range on 550,000 shares, the heaviest session of the week at 29.7% of its volume.
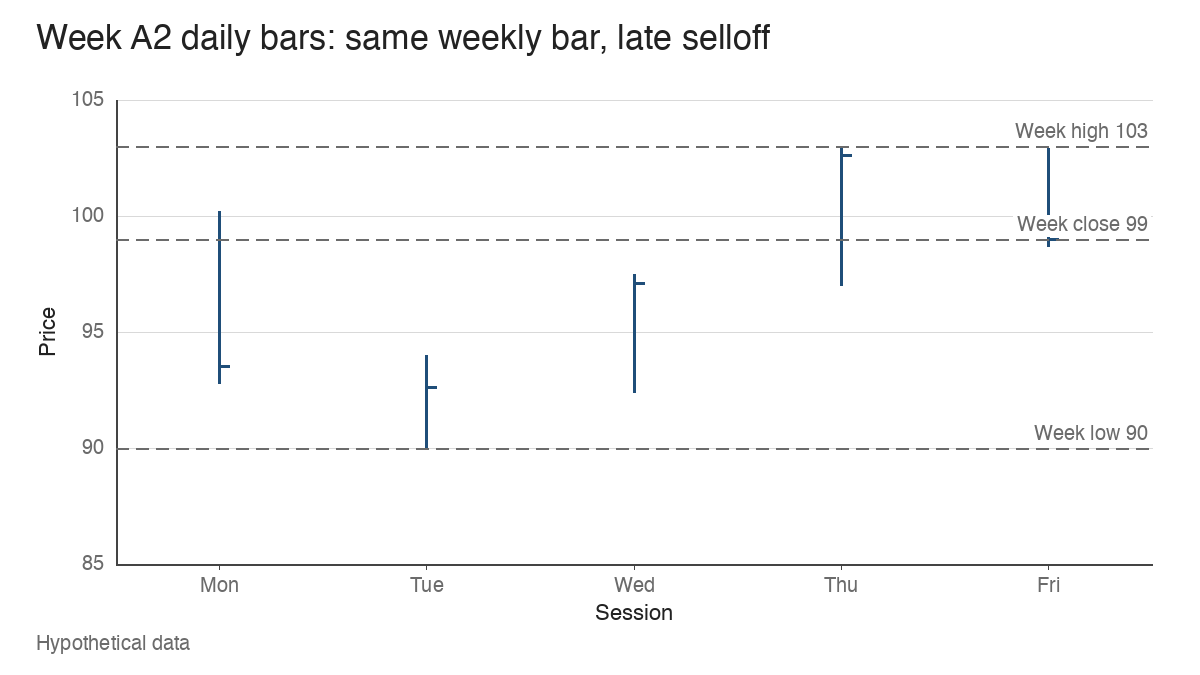
On a weekly chart, A and A2 are indistinguishable. On a daily chart, A2 ends with a high-volume reversal from near the top of the week, which is the opposite of the finish in Week A. I’d treat A2’s Friday as the more important fact about that week, because it’s the most recent evidence and it was the busiest session. A trader using weekly charts for structure might still pull up the daily bars for any week that looks like supporting action, specifically to check where the volume sat and how the final session behaved.
Where the week sits in the base
Context decides most of the reading. Put Week A inside a hypothetical established uptrend: the stock advanced for several months, peaked at 118.00, and began a base. An earlier consolidation topped at 92.40, and the breakout from that level started the move to 118. The 10-week moving average is rising and sits at 102.80 in Week A.
From that setup, Week A’s low of 90 puts the base at 23.7% deep. The low undercut the old 92.40 level by 2.6%, then the week closed at 99, 7.1% above it. The close is still 3.7% below the 10-week line. In plain terms, the stock briefly broke a level that used to matter, recovered above it within the week, and remains under its rising average. That reads as a test of prior support around a former breakout level, with the outcome still open.
Week B in the same base reaches a similar depth, 23.3%, but closes at 91.20, 1.3% below 92.40 and 11.3% below the 10-week line. Same structure, same volume, and the old level failed to hold at the close.
The behaviour of nearby weeks matters as much as the bar itself. Three versions of the following weeks show why:
| Sequence | What the weeks show | Reading of the recovery week |
|---|---|---|
| Isolated recovery | The week after A closes at 104.00 (+5.05%), 90.3% up its range, on 0.88 times average volume, back above a 10-week line at 103.10 | The recovery held and the next week confirmed it on quieter trade |
| Repeated deterioration | Instead of A, three weeks close 12.7%, 13.2% and 10.6% up their ranges on 1.21, 1.35 and 1.58 times average volume, with the last low at 87.60 | No supporting week appeared; the low is 5.2% under 92.40 and the base is 25.8% deep |
| Rebound in a damaged base | The stock has already fallen to 73.00, 38.1% off the 118 high; a week with prior close 80, high 82, low 73 and close 79.20 finishes -1.0% and 68.9% up its range, 8.3% below a declining 10-week line at 86.40 | The bar’s shape matches A, but it sits inside a structure that’s already broken |
The third row is the common misread. Its net change and closing location are almost a copy of Week A. A screen keyed on those two numbers would flag both. One is a recovery near support in a 23.7% base under a rising average; the other is a bounce in a 38.1% decline under a falling one, closer to the problems described in a wide and loose base. A good-looking bar can’t repair the structure around it.
The first row also connects to a familiar situation. When a leader’s first pullback to the 10-week moving average produces a week like A, the recovery and the average are describing the same thing from two angles. When the stock has been below a declining 10-week line for weeks, a recovery bar is answering a different question.
Later evidence can rewrite the week
A weekly bar is read once on Friday and then re-read every week after. If the stock in Week A drops below 90 two weeks later on heavy volume, the earlier recovery becomes the first leg of a failed test rather than evidence of support. If it holds above 92.40 and the following weeks tighten, the same bar gains weight in hindsight.
Earnings change the reading in both directions. A report two weeks after Week A can gap the stock through the 90 low or away from it, and the market’s response to the numbers will dominate anything the recovery suggested. The broader market matters too. A recovery week during an index correction, with distribution days piling up, tells you less about the individual stock than the same bar in a healthy tape. In a weak market, a recovery week can simply track a bounce in the index.
The weekly-chart approach associated with William O’Neil treats this kind of bar as one clue to weigh alongside the base, the market and the fundamentals. That’s a sensible framing: the bar is input to a judgement that keeps updating as new weeks arrive.
Holiday weeks, scheduled events and lost detail
Three practical limits change the arithmetic.
Holiday-shortened weeks distort the volume comparison. Suppose a four-session week trades 1.50 million shares. Against the 1.20 million weekly average that’s 1.25 times. Per session, it’s 375,000 against 240,000, or 1.56 times. The weekly total understates how active those four days were, so a short week that looks average may have been busy, and the closing location also reflects one fewer day of trading.
Scheduled events inflate volume for reasons unrelated to support. An earnings week trading 3.40 million shares is 2.83 times the average, and index rebalancing days or option expirations can add their own spikes. A recovery on that kind of volume is mostly a reaction to the event, and the volume ratio should be read with that in mind. You can check the calendar before reading the volume column.
Weekly aggregation discards the order of events, and Weeks A and A2 already show the cost. The weekly bar also drops gaps, the distribution of volume across days, and anything that happened in the final hour. That’s acceptable when the weekly chart is used for structure. It becomes a problem when a single weekly bar is asked to carry a conclusion.
Possible support is a long way from a pivot
Week A, read in full, is evidence that buyers absorbed a 10% decline near a former breakout level and pushed the stock back to 99 on above-average volume. That’s worth recording. It still falls short of several things it’s often mistaken for.
The base isn’t complete. The stock is 16.1% below its 118 high and under its 10-week line, so the right side of the pattern hasn’t been built. There’s no valid pivot either, because a pivot needs a defined area of resistance at the top of a finished base, and Week A sits near the bottom. And the bar on its own isn’t a trading signal. A trader using this pattern might mark 90 as the low the structure now has to respect and wait to see whether the following weeks hold above 92.40 and tighten. If they do, the recovery week becomes part of the evidence for a base worth watching. If they don’t, it was a bounce.
Learn the pattern. Ride the trend. Keep the gains.
Educational content only. Not investment advice. Trading involves risk. You are responsible for your decisions.
Get the free Market Wisdom e-book
Join Trends and Breakouts — historical winners, breakout studies, and risk lessons. No spam, unsubscribe anytime.