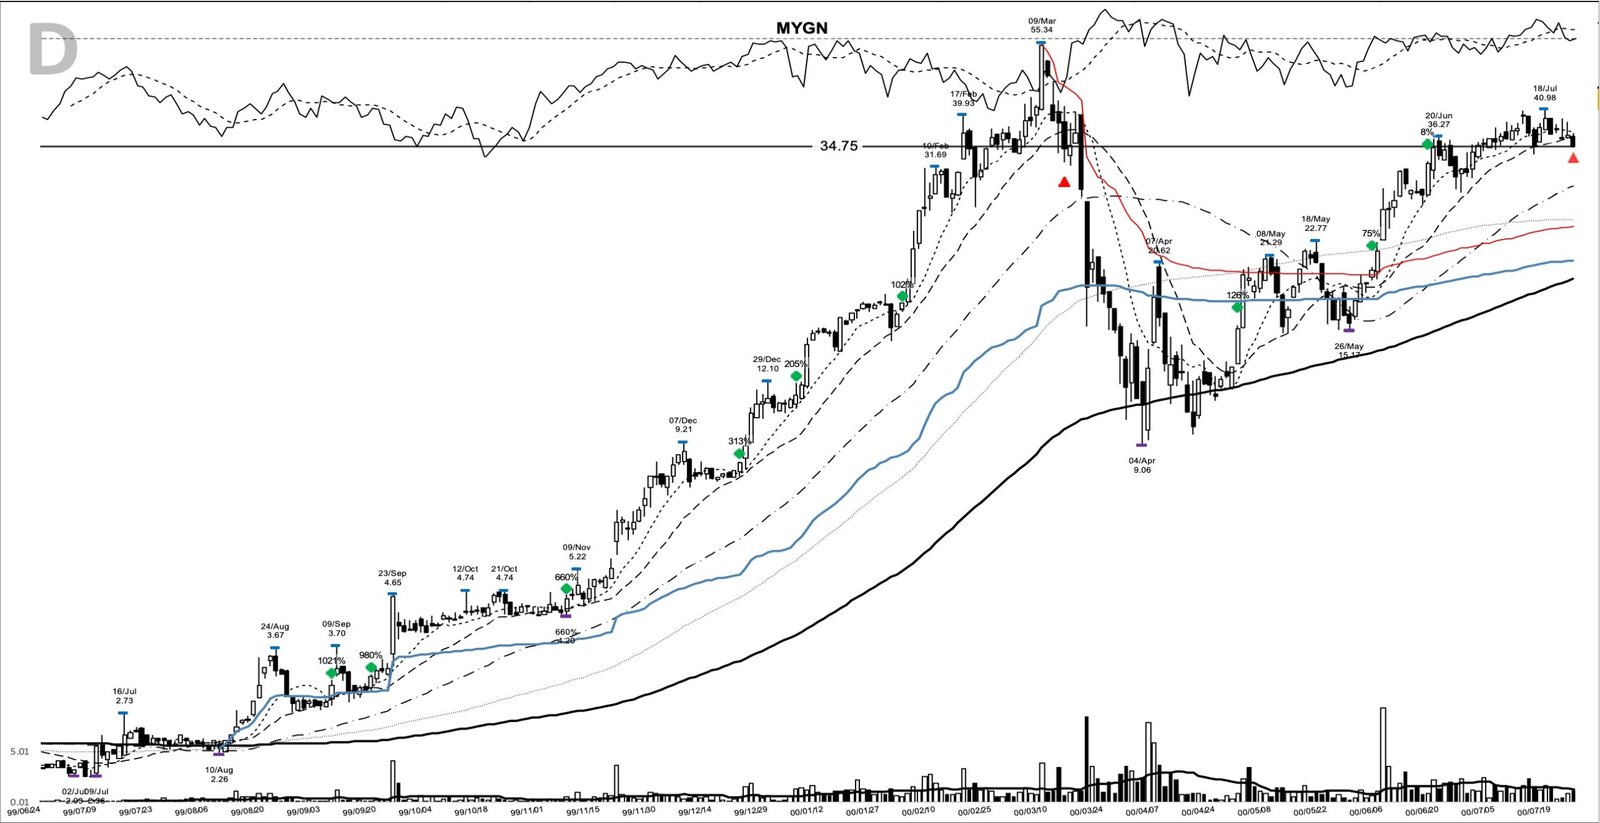
From September 1998 to mid-August 1999, Myriad Genetics traded between a 1.70 low and a 3.34 high, a gene-discovery company whose stock had gone nowhere for eleven months. MYGN is back on traders’ screens this week, ninth on Stocktwits’ trending list, and when it shows up there, this is the chart worth studying. The mygn base breakout in one line: an anticipatory entry in September 1999 below a 3.67 pivot, followed by a 1021.2 percent move in 321 calendar days through the genomics boom and its crash.
Key takeaways from the MYGN base of 1998 and 1999
- The pattern: an eleven-month base between 1.70 and 3.34, then an August 1999 push to 3.67.
- The entry: a 3.10 close on 8 September 1999, 15.6 percent under that high, on volume 0.7 times the 20-day average. The pivot cleared on 23 September at 4.62.
- The move: a 55.34 peak on 9 March 2000 and a final exit at 34.75 on 25 July 2000, +1021.2% from the first entry close to the final exit close in 321 calendar days, a price change rather than a position or account return.
- The adds: eight more buy points, three of them after the spring 2000 crash.
- The lesson: both sell points fell on the first close under the 20-day moving average after a sustained run above it.
The MYGN trade at a glance
| Field | Value |
|---|---|
| Ticker | MYGN |
| Study entry date (anticipatory) | 8 September 1999 |
| Entry close | $3.10 |
| Pivot | $3.67 (20-day high, 24 August 1999) |
| Pivot cleared | 23 September 1999, close $4.62 |
| Volume vs 20-day average | 0.7x |
| Exit date | 25 July 2000 |
| Exit close | $34.75 |
| Price change, entry close to exit close | +1021.2% |
| Calendar days | 321 |
| Peak before exit | $55.34 (9 March 2000) |
How the MYGN base breakout formed under 3.67
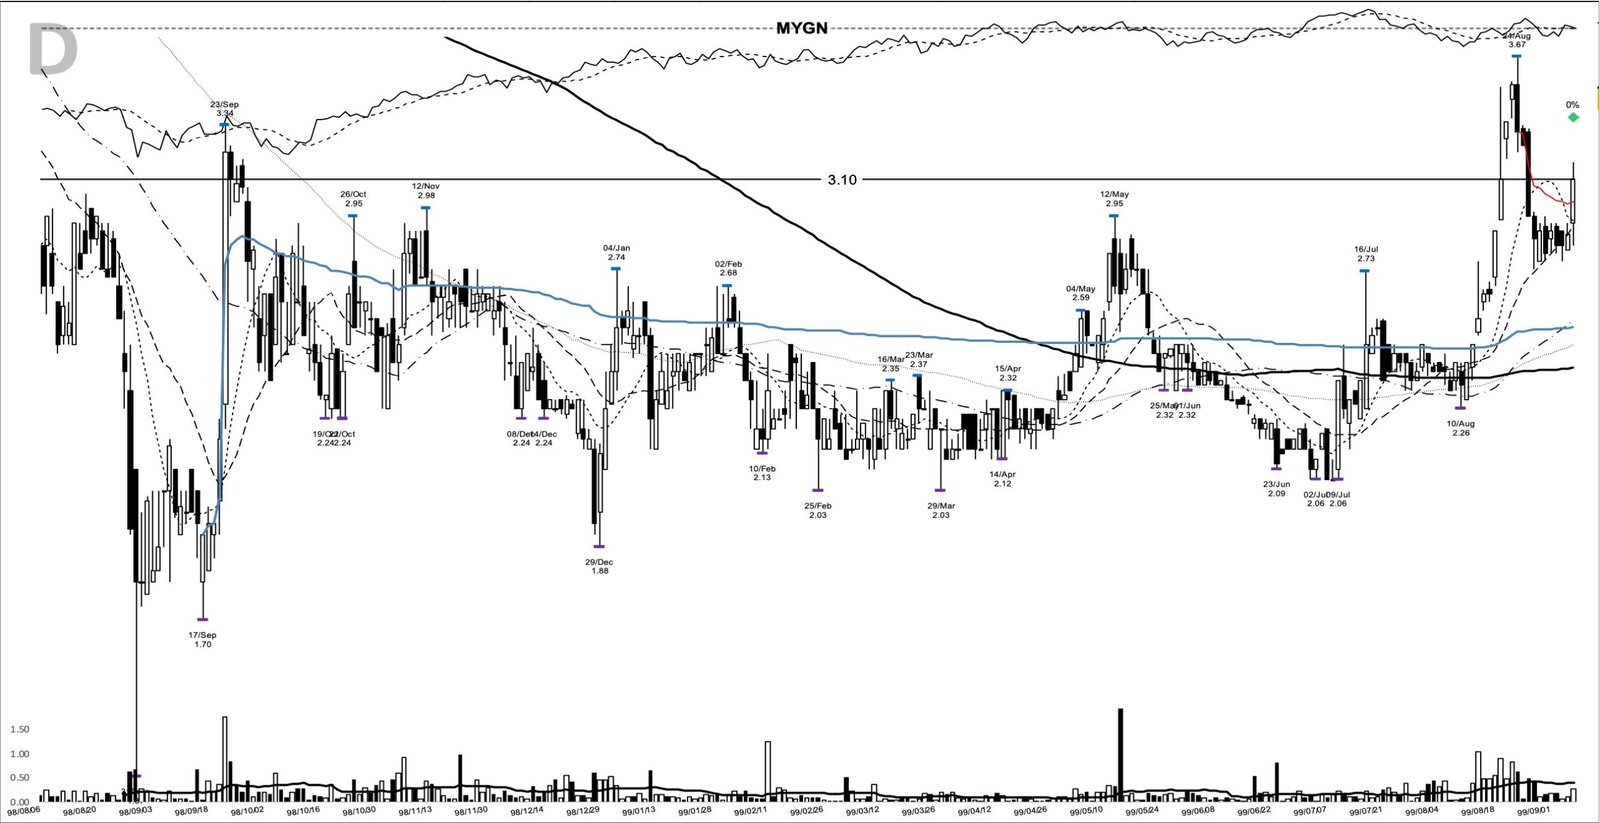
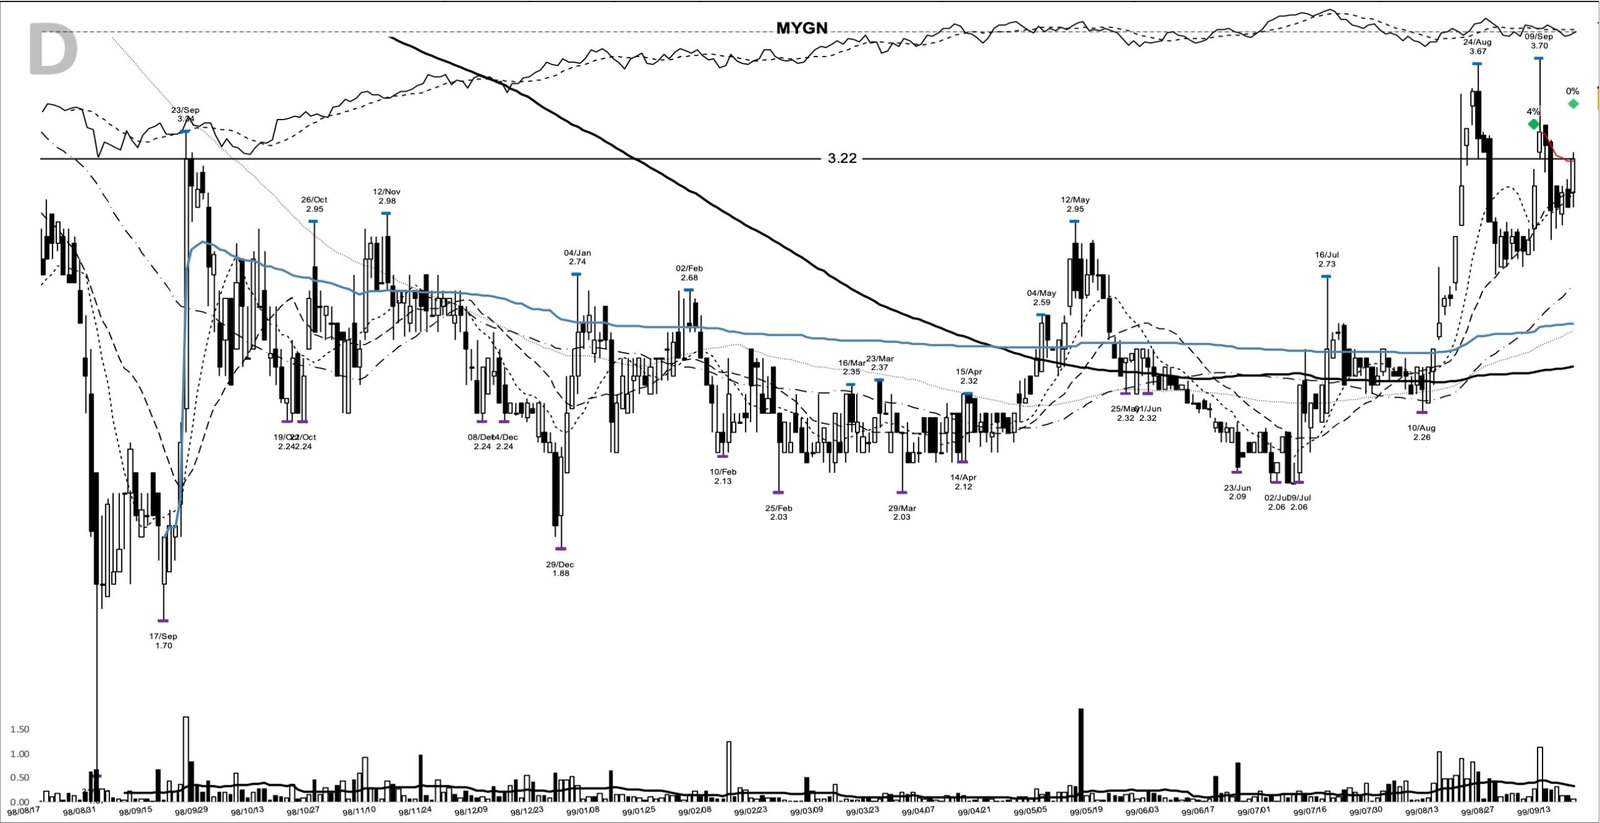
After the 3.34 high of 23 September 1998, the stock spent eleven months in a range it couldn’t leave. Lows came in at 1.88 on 29 December 1998, 2.03 on 29 March 1999 and 2.06 on 7 and 8 July.
August 1999 changed the chart. Volume reached 1,033,511 shares on 13 August, and on 20 and 23 August MYGN closed at 3.35 and 3.53, its first closes above the 3.34 ceiling. The push topped at 3.67 on 24 August, which became the 20-day pivot and left a six-month base 44.7 percent deep down to the 2.03 March low.
After a sharp drop on 26 and 27 August, volume dried up to 75,919 shares by 3 September, and the 2.77 low held on both 31 August and 3 September.
On 8 September the stock ranged from 2.83 to 3.17 and closed at 3.10, up 7.8 percent and back above its 10-day average. Volume ran 0.7 times the 20-day average, so the bar carried no volume confirmation. This was an anticipatory entry, 15.6 percent under the 3.67 pivot. The next day MYGN traded to 3.70 on 1,140,889 shares but closed at 3.34, an intraday poke that didn’t hold. The close that cleared the pivot came on 23 September 1999: 4.62, on 4,076,582 shares.
Before that, there was an opportunity to add on 17 September at 3.22, one session after the first close under the 10-day line since the entry.
Myriad Genetics in 1999: gene partnerships, a cancer test and losses
Per its 1999 annual report, the company ran three businesses: gene discovery under partnerships with drug makers including Bayer, Schering AG, Novartis and Monsanto; Myriad Pharmaceuticals, formed in April 1999 to develop its own drug candidates; and a laboratory selling the BRACAnalysis genetic test for inherited cancer risk.
The test was gaining traction: the report said molecular diagnostic revenue had more than doubled, and Aetna U.S. Healthcare had agreed to cover it for high-risk members. The company still ran at a loss.
The SEC dataset behind this study carries no quarterly EPS or revenue history for 1999, so no growth figures are quoted here. In William O’Neil terms, MYGN was a story stock with a product finding its market, without the accelerating earnings his screens look for.
Autumn 1999: biotech catches the tech rally
Biotech joined the technology boom late. The Nasdaq Biotechnology Index went on to an all-time high of 1596.53 on 6 March 2000, a level it was still well below four years later, per a 2004 Motley Fool review. Genomics, with the human genome nearly sequenced, sat at its center.
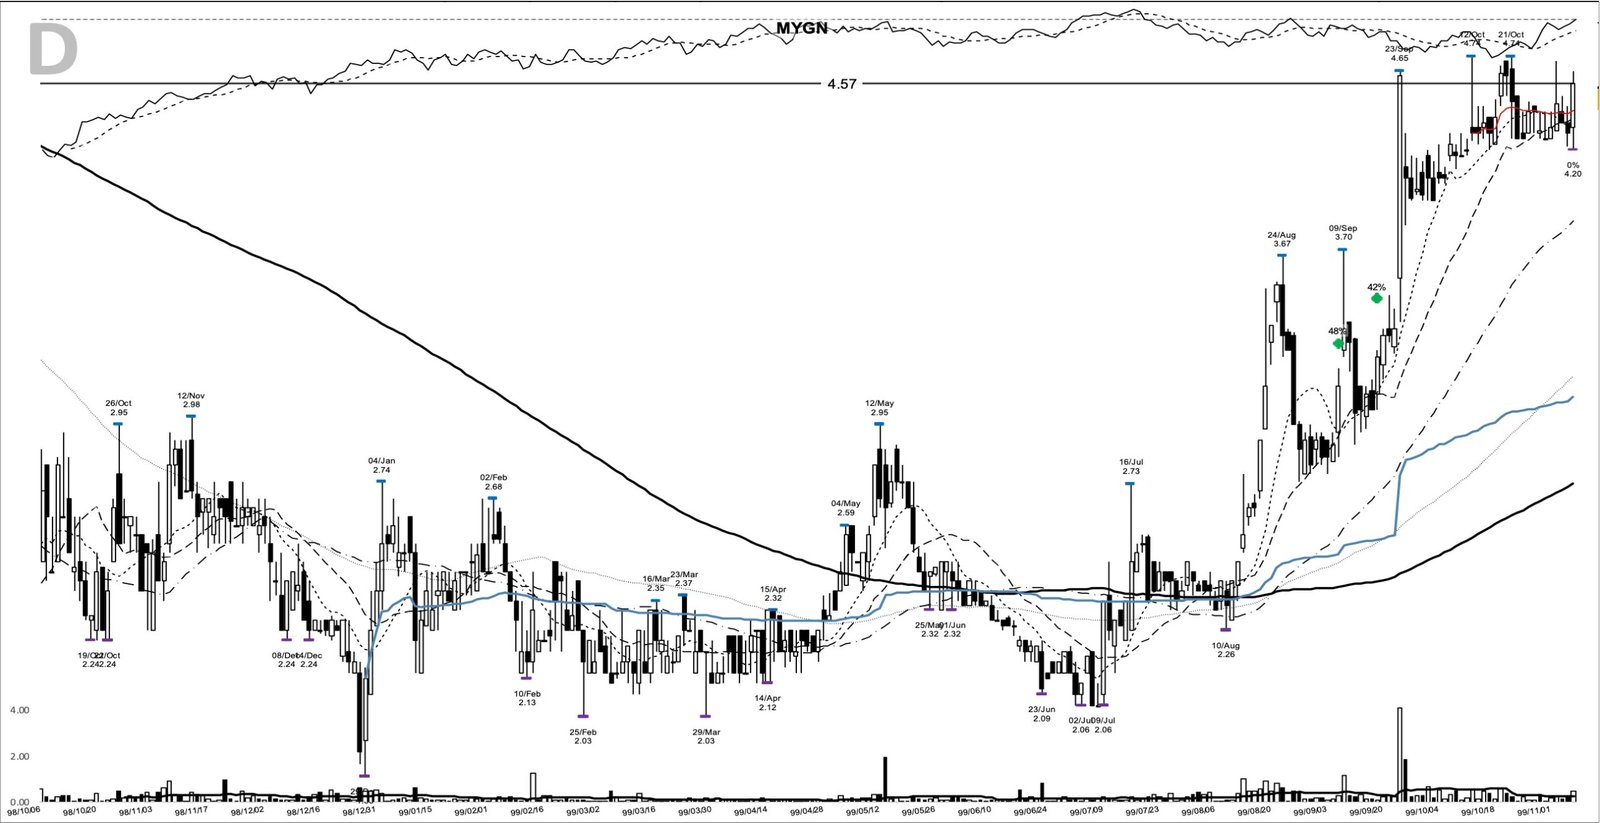
MYGN spent October above the cleared pivot, with closes between 3.93 and 4.63. It slipped under its 20-day line on 29 October and 4 November, then closed back above it at 4.57 on 5 November, another add point.
Preparing for the 3.67 pivot in September 1999
On the entry day the 10-day, 20-day and 50-day moving averages sat at 2.93, 2.91 and 2.56. The 3.10 close was 5.8 percent above the 10-day line, the first close back above it since the August pullback.
The watchlist case was the August closes above an eleven-month ceiling, then a quiet pullback that stopped at 2.77, well above the 2.03 base low.
A trend follower’s plan that day might have read: enter on a close above the 3.67 pivot, with an initial stop under the 2.77 shelf low of 31 August. That’s 0.90 a share, or 24.5 percent of the pivot price. The 2.03 low of 29 March 1999 marked where the whole structure would fail. Then trail the 10-day line, widening to the 20-day once the trend was well advanced.
The anticipatory entry carried a different risk. Against the same 2.77 stop, the 3.10 close risked 10.6 percent. A close-basis plan had to wait for the 4.62 close on 23 September, where the same 2.77 stop sat 40.0 percent under the price, so either the stop moved up or the size came down.
From 3.10 to 55.34: the first leg and the 15 March exit
The trend found its pace on 18 November, a 22.7 percent day to 6.44 on 3,666,365 shares. After a 9.21 high on 7 December, closes held between 7.72 and 8.20 for two weeks, and on 21 December the stock closed at 8.40, 171.1 percent above the first buy. Two sessions later it was at 10.49.
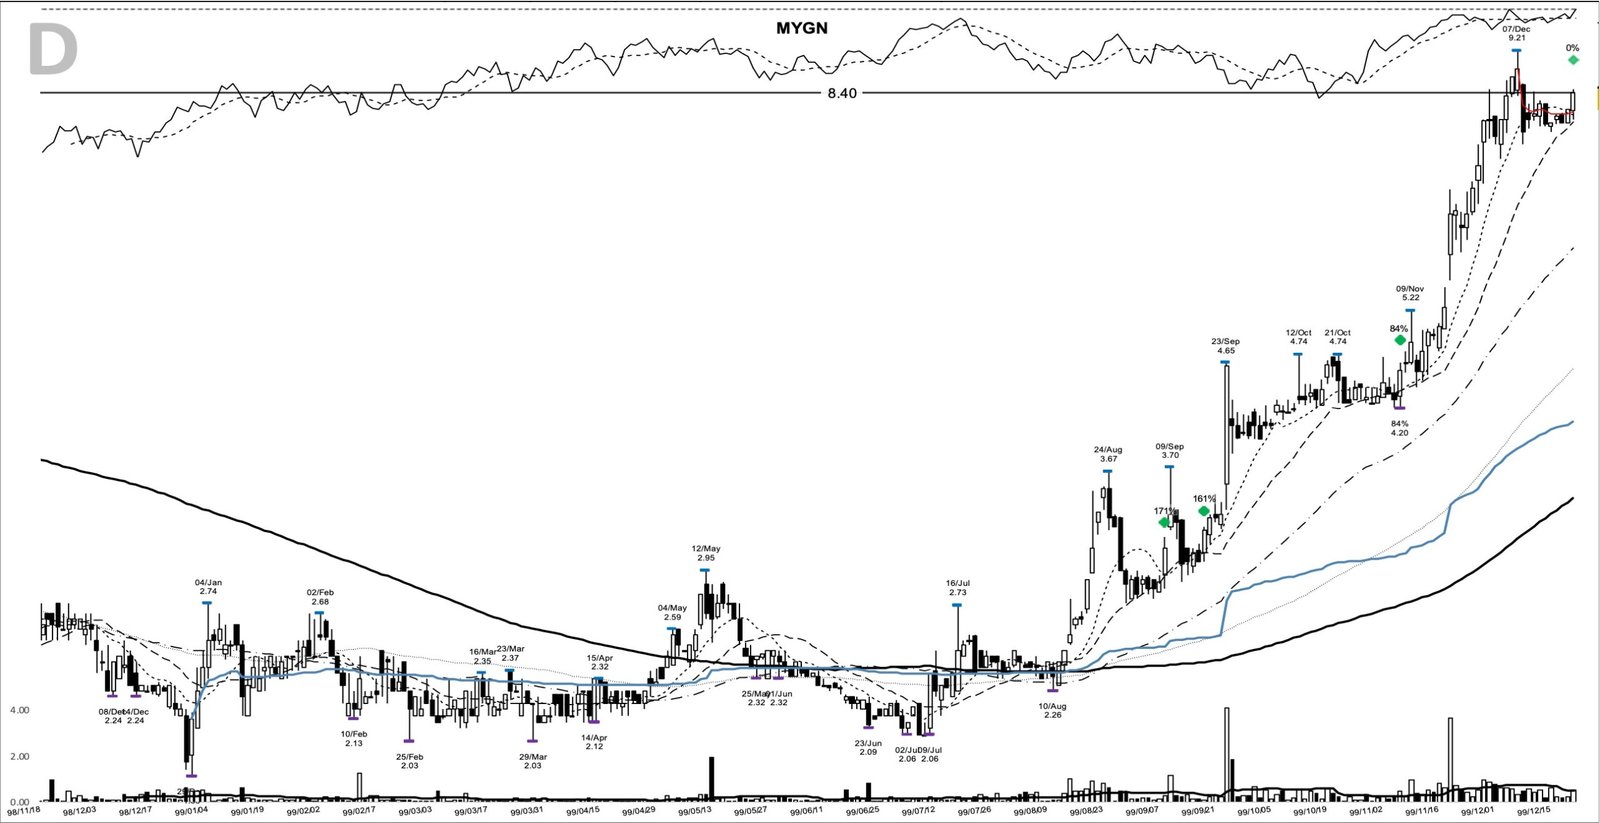
Over the holidays closes stayed between 10.49 and 11.21. On 5 January 2000 MYGN closed at 11.38 on 1,251,622 shares, and two sessions later it was at 14.30.
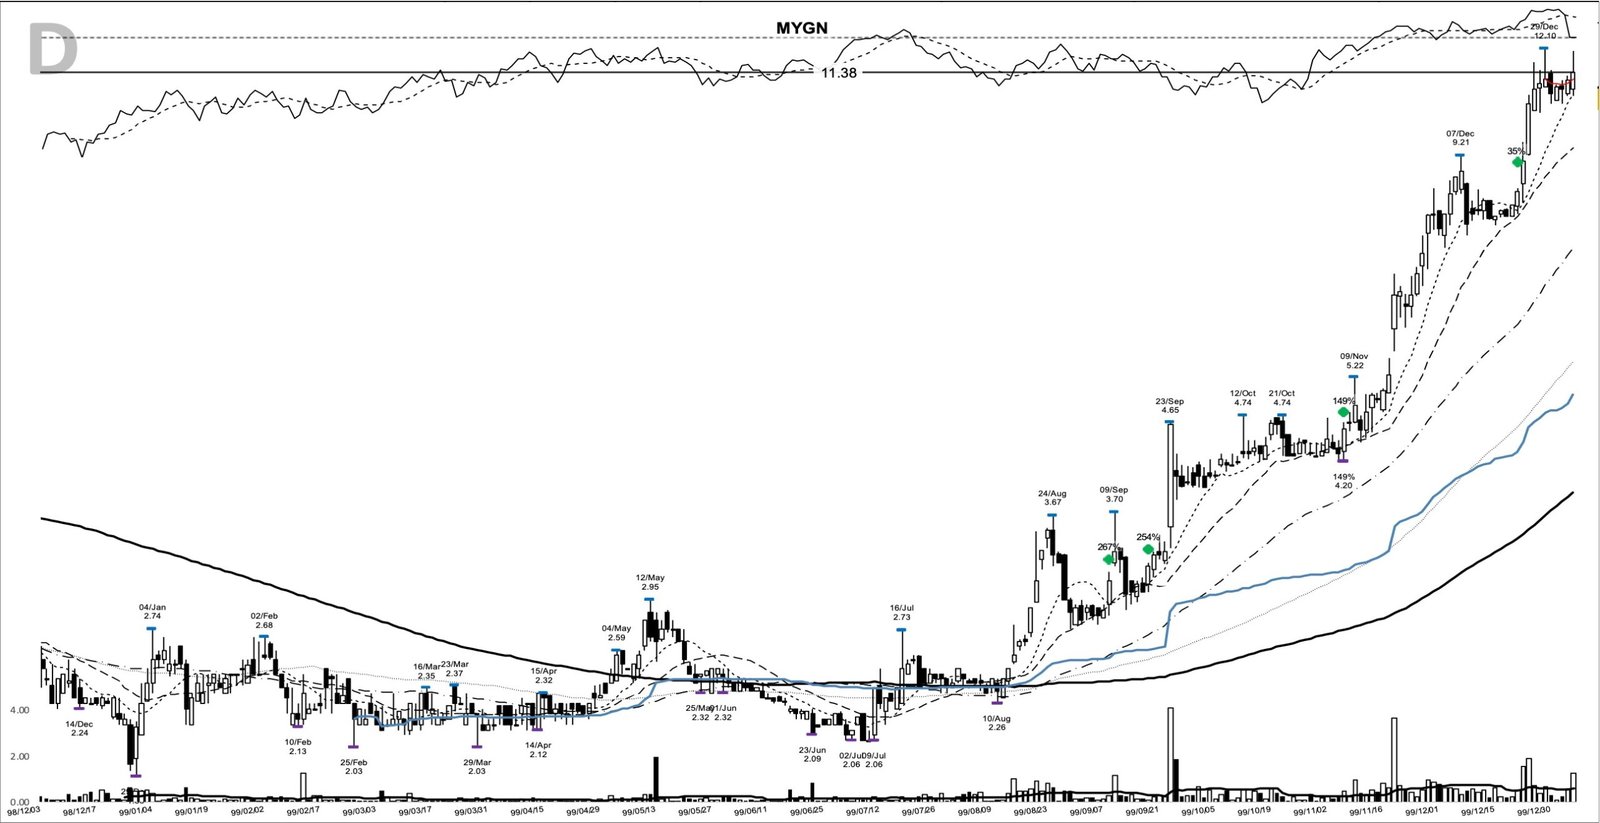
On 31 January the stock dropped to 14.48 and closed at 15.38, under its 10-day line. Two sessions later it closed at 17.23, 455.7 percent above the first buy. Adding on that kind of recovery is the core of pyramiding into a position.
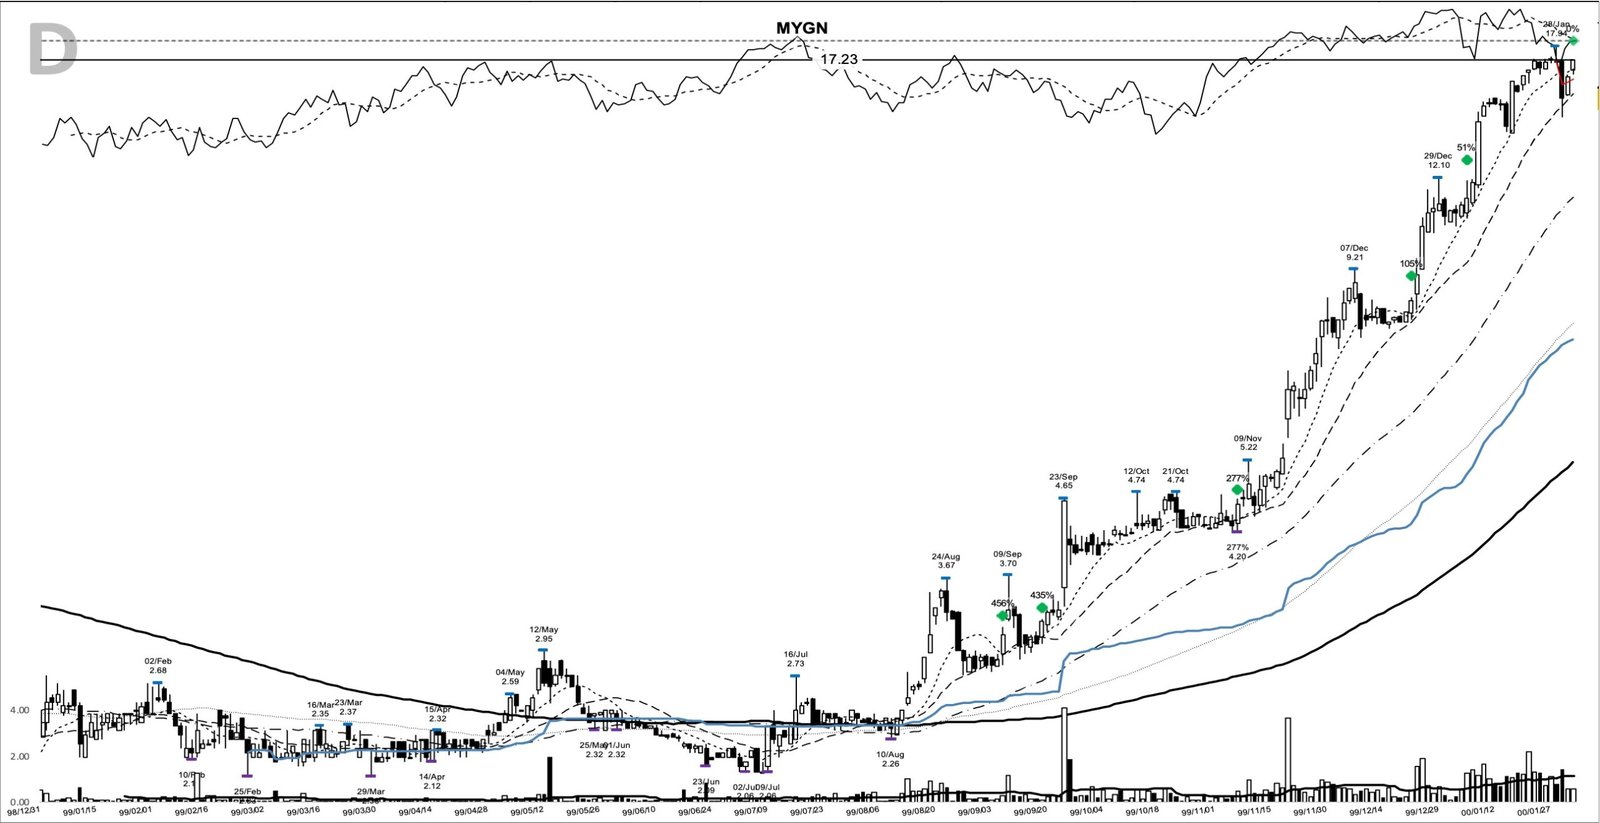
February went vertical: 21.93 on 4 February, 36.95 on 17 February. On 9 March MYGN jumped 32.5 percent in a session to a 54.80 close, after trading as high as the 55.34 peak.
Three sessions later the sector cracked. On 14 March 2000 a joint statement from President Clinton and Prime Minister Blair, calling for human genome data to be freely available, set off a sell-off across genomics stocks, as Nature and The Scientist reported. MYGN traded down to 33.62. On 15 March it closed at 34.47, under its 20-day line for the first time since 4 November 1999. That was the first sell point, 1011.8 percent above the first buy.
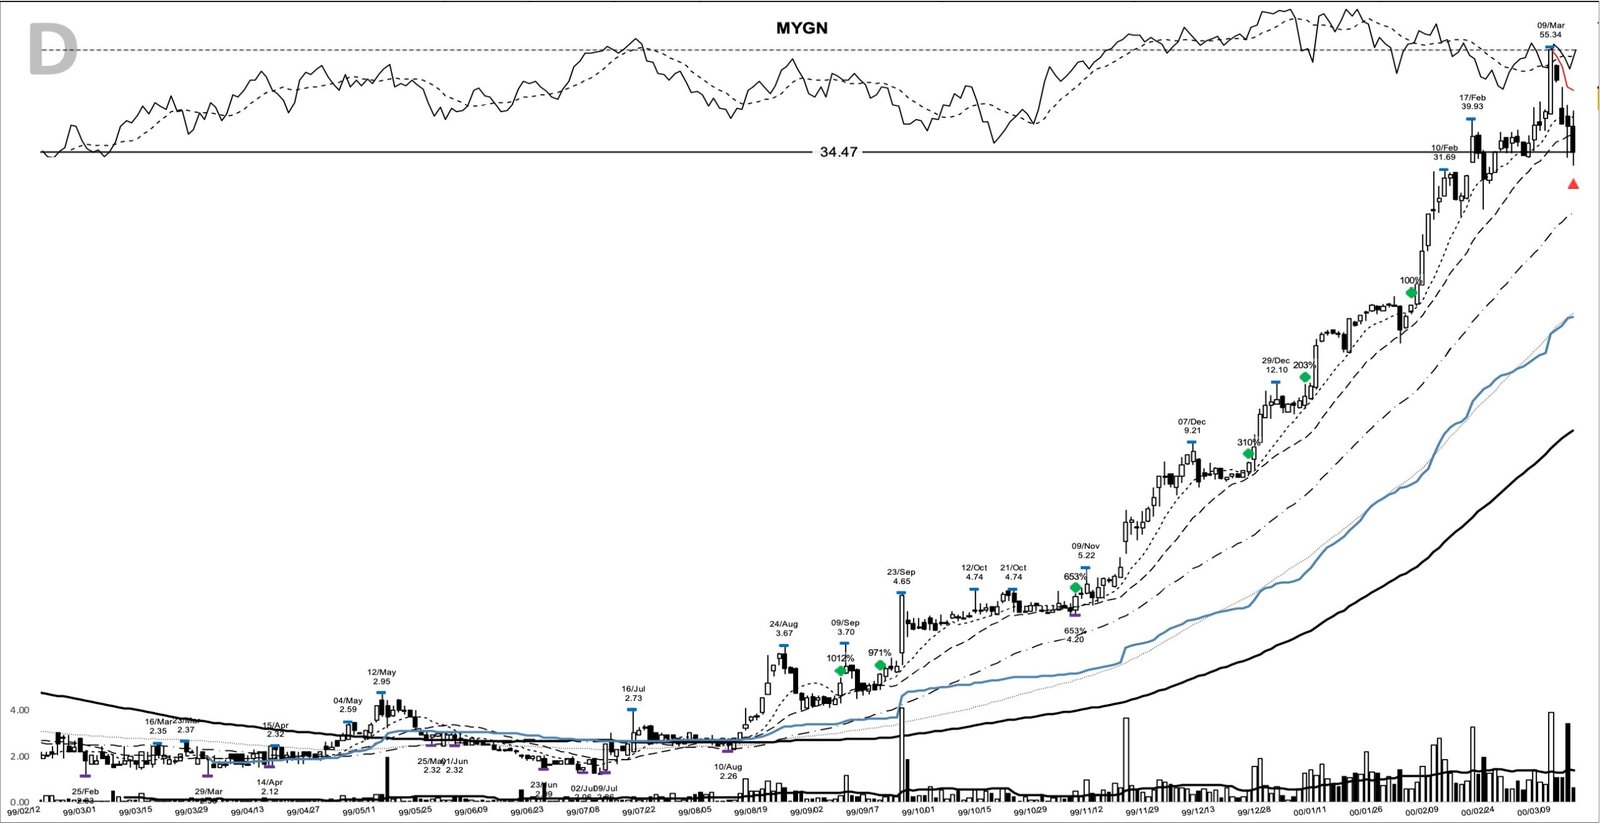
The fall to 9.06 and the MYGN second leg into July 2000
On 21 March MYGN closed at 18.52 on 8,499,625 shares, and on 4 April it traded as low as 9.06, 83.6 percent under the peak.
On 28 April the stock closed at 15.35, back above its 10-day and 20-day lines though far under the 50-day at 24.07, and the next session it reached 19.55.
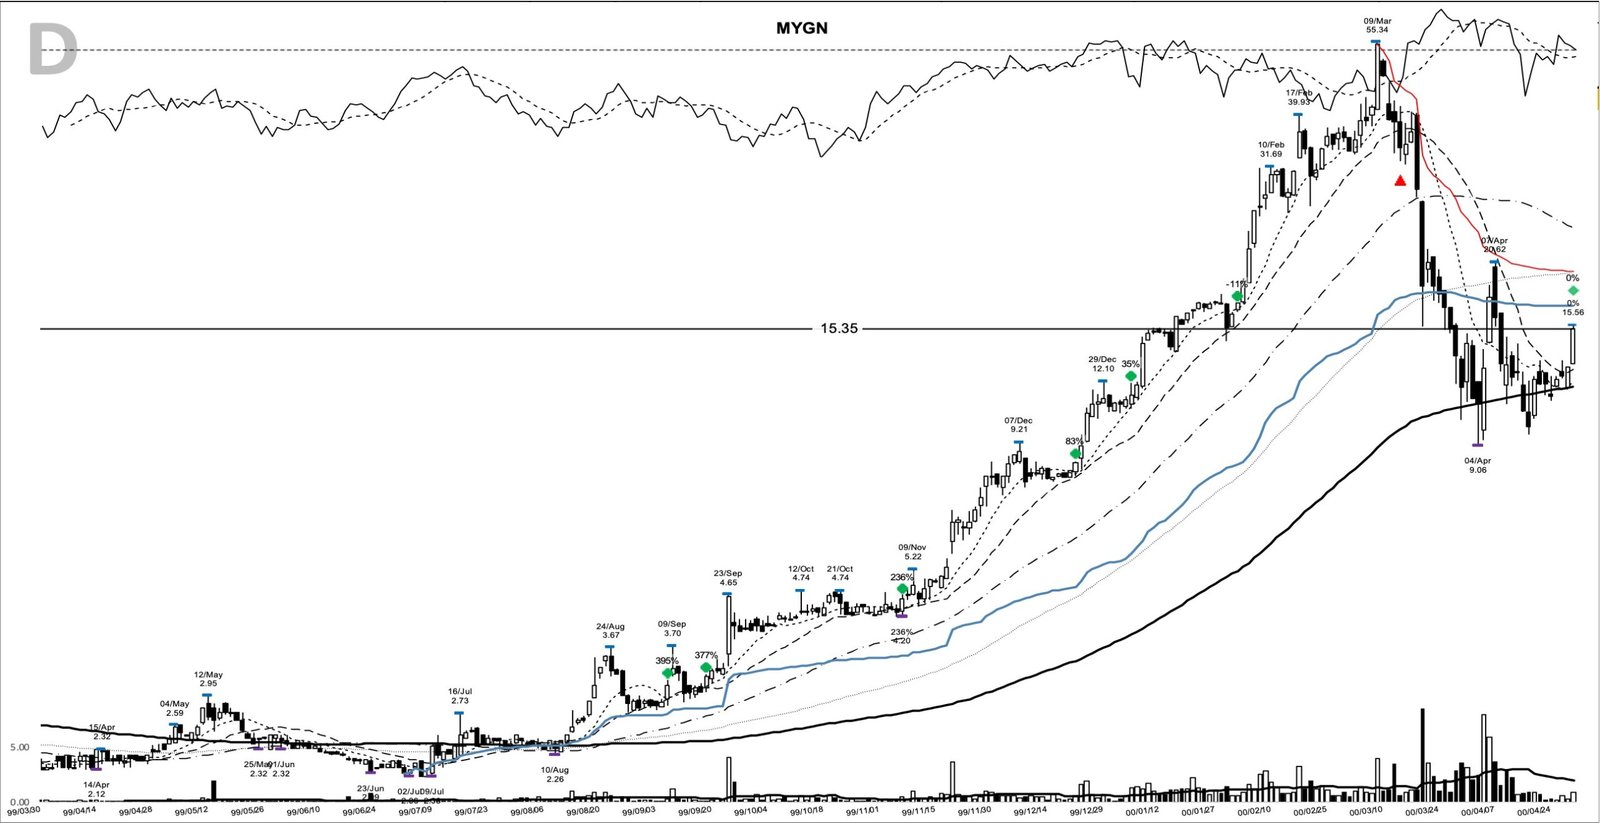
Late May brought closes under the 20-day line and a 15.17 low on 26 May. On 2 June MYGN closed back above that line at 19.91, and on 6 June it closed at 26.21 on 9,299,506 shares, the heaviest session in the data set.
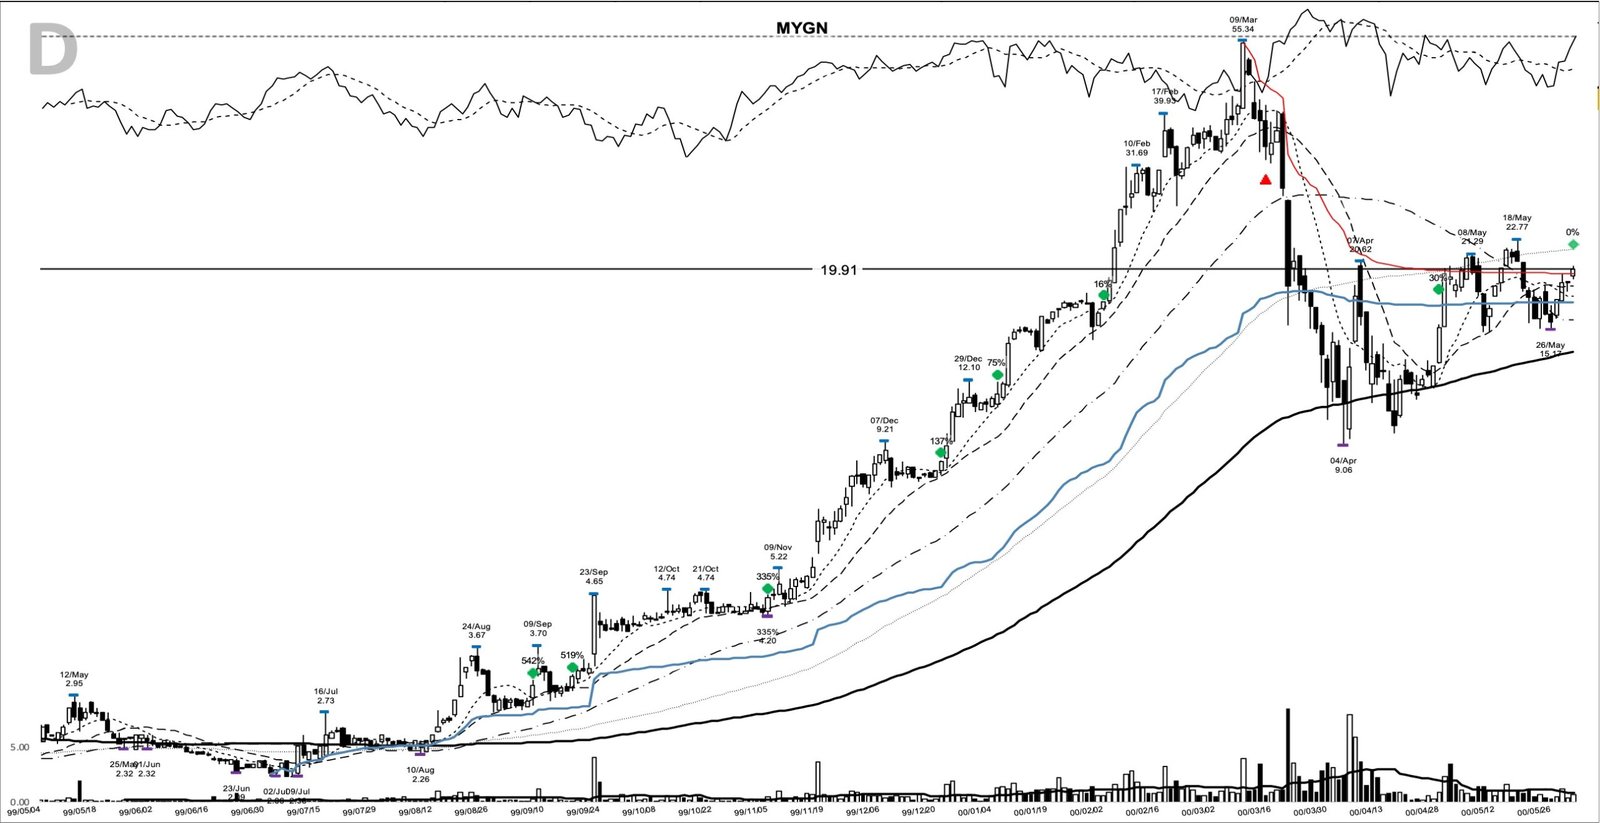
After four closes between 27.91 and 29.41, the stock closed at 32.24 on 16 June. The second leg topped at 40.98 on 18 July.
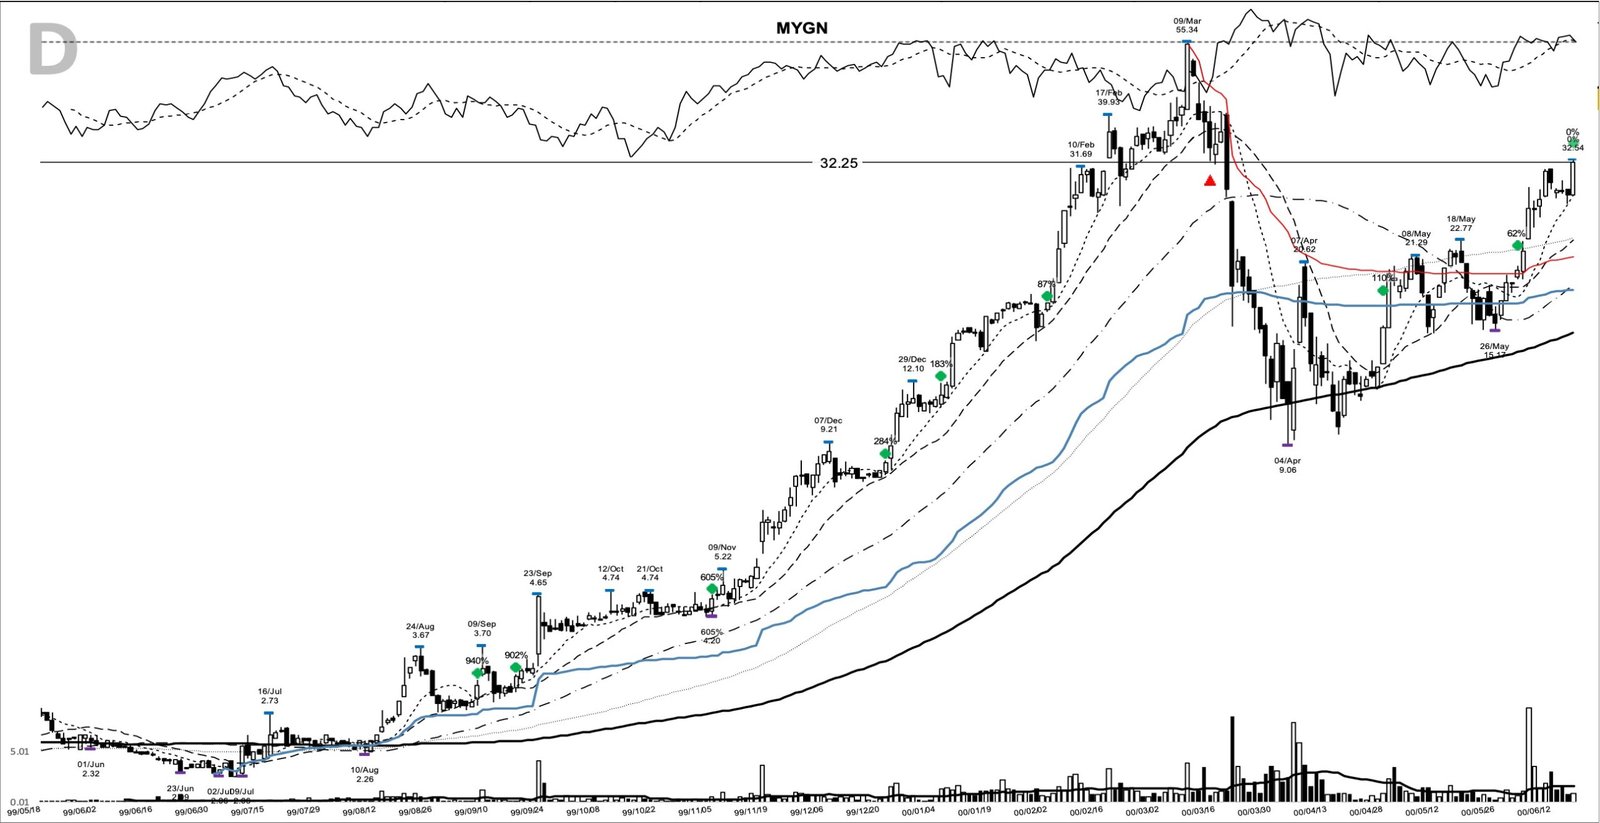
On 25 July 2000 MYGN closed at 34.75, its first close under the 20-day line since 30 May. That was the exit: 1021.2 percent above the first buy, 321 calendar days later and 37.2 percent under the March peak. A thousand dollars riding the full move would have become about 11,200 dollars, though riding it straight through meant sitting through the drop from 55.34 to 9.06.
Where the MYGN chart can mislead
The entry bar is the first trap. A 3.10 close on below-average volume, 15.6 percent under the pivot, showed no demand. It only looks obvious with the rest of the chart in view.
The second is the pivot day. A buy-stop at 3.67 would have filled on 9 September and finished the session underwater at 3.34. Closes under the 20-day line followed on 13, 14 and 16 September, action that reads like a failed breakout, while the 2.77 shelf held with a 2.88 low.
The third is the early trail. MYGN first closed under its 10-day line on 16 September at 3.01, below the entry, so a 10-day trail from day one would have closed the trade at a small loss a week before the pivot cleared.
The last is the headline number. The +1021.2% runs from the first buy to the final exit, and the path between them included an 83.6 percent collapse. The 15 March sell point would have sidestepped most of that drop.
What MYGN teaches about the 20-day line in a mania
Twice on this chart, the first close under the 20-day moving average after a sustained run above it marked the end of the move: 15 March 2000 at 34.47, and 25 July 2000 at 34.75. The first came a day after a sector-wide news shock; the second ended a recovery from 9.06 to 40.98. In a market moving this fast, a trailing rule set in advance did the deciding.
Learn the pattern. Ride the trend. Keep the gains.
Related studies: the INCY base breakout of 1999, another genomics name from the same boom, plus the NTAP base breakout of August 1999 and the MSTR base breakout of August 1999. A new winner study lands most evenings.
Price and volume figures are computed from split-adjusted daily OHLCV data; company figures come from SEC filings where cited.
Educational content only. Not investment advice. Trading involves risk. You are responsible for your decisions.
Get the free Market Wisdom e-book
Join Trends and Breakouts — historical winners, breakout studies, and risk lessons. No spam, unsubscribe anytime.