Twist Bioscience is back among the day’s biggest gainers, which is what pulled this old chart out of the archive. Back in the spring of 2020, TWST spent months grinding through a wide base while the whole market crashed and recovered around it. Then it broke, and it kept going. The TWST base breakout, entered 5 May 2020, is a clean model of how a real leader sets up and trends: a six-month base, a 33.74 close, and a 359% run that held for 288 days.
What makes this one worth walking through is everything that came after the entry, when the trend did the heavy lifting and the chart kept offering places to add.
Key takeaways from the TWST breakout
- TWST built a six-month base into the breakout: a high of 35.91 on 6 March 2020, a COVID washout to 18.52 on 17 March 2020, a base 48.4% deep.
- The entry close was 33.74 on 5 May 2020, on 0.9x average volume. The 35.00 pivot broke the next session on roughly twice the average volume.
- From that 33.74 close, the trend ran to a 214.07 peak on 21 January 2021 and a 154.95 exit on 17 February 2021: a 359% move held 288 calendar days.
- The chart offered at least six add-on points on the way up, from a 45.30 close in June 2020 to a 144.60 close in December 2020.
- The edge here was trend-following discipline, adding into strength and holding, not nailing the exact low.
The TWST trade at a glance
| Field | Value |
|---|---|
| Ticker | TWST |
| Study entry date (anticipatory) | 5 May 2020 |
| Entry close | 33.74 |
| Pivot | 35.00 |
| Pivot cleared | 6 May 2020 at a close of 37.22 |
| Volume vs 20-day average | 0.9x |
| Exit date | 17 February 2021 |
| Exit close | 154.95 |
| Gain | +359.2% |
| Calendar days held | 288 |
| Peak before exit | 214.07 (21 January 2021) |
The TWST chart at the 5 May 2020 entry
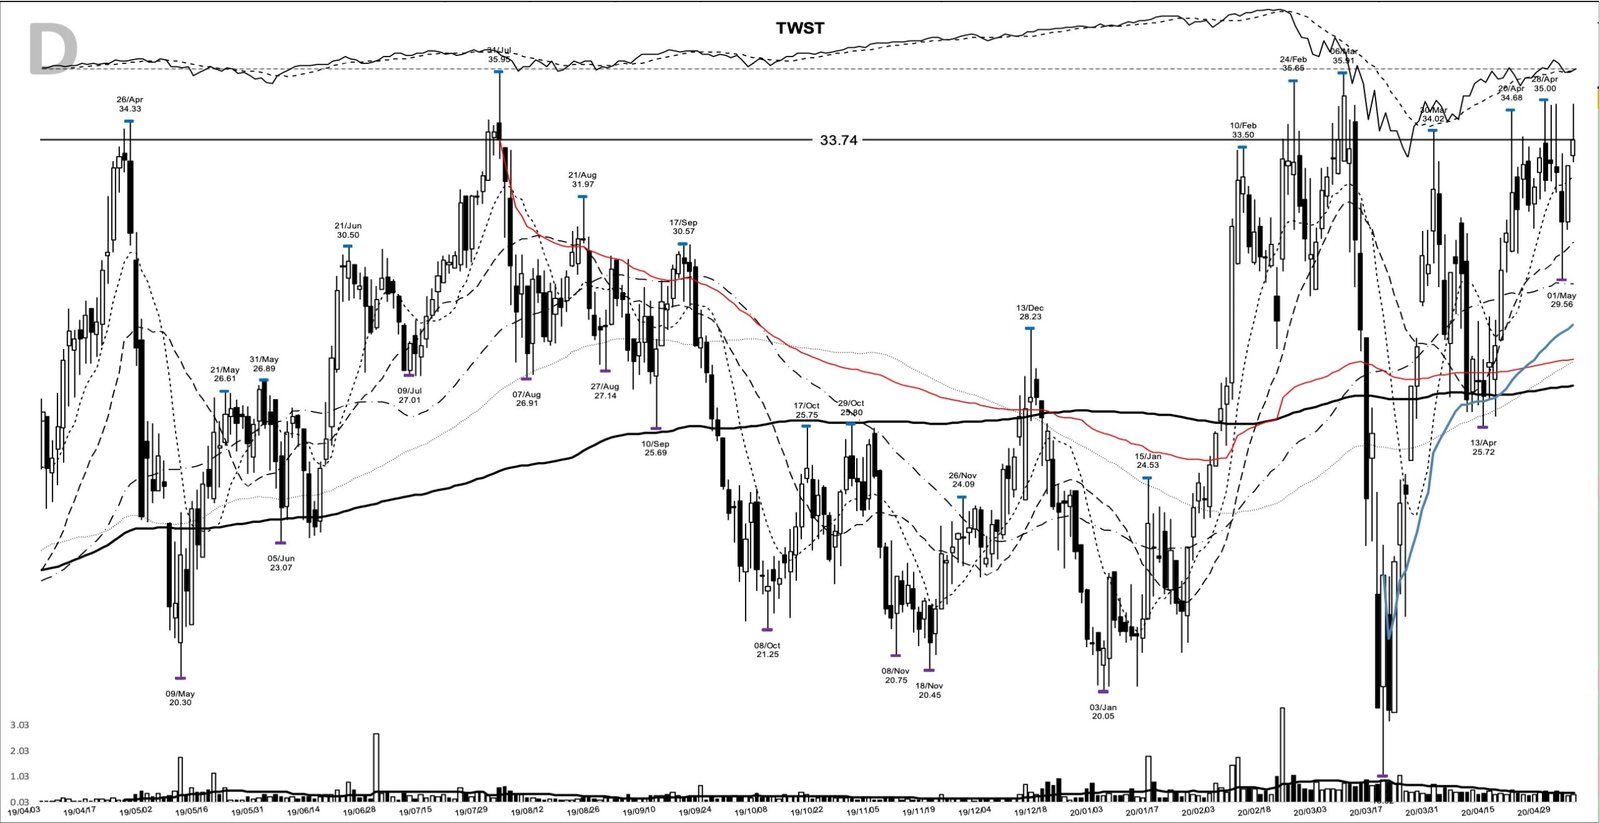
The chart above comes from my study archive. Read it as a whole picture first. Through the back half of 2019 the stock drifts lower off a 35.95 high made on 31 July 2019, then the COVID crash drives it to 18.52 on 17 March 2020. What follows is a sharp V recovery that carries price right back into the old highs by late April. The moving averages, buried and pointing down in March, roll up and stack in order by the start of May. That posture, price reclaiming a long base with the averages turning up underneath it, is the setup stage analysis calls the transition into a new advance.
How TWST coiled under 35.00 before it ran
Every return here runs from the entry close of 33.74 on 5 May 2020. Name that number once and the rest of the chart reads plainly. On the entry day, TWST closed at 33.74 on volume of 329,309 shares, about 0.9 times its 20-day average of 384,043. That’s a quiet day, with price coiling just under the 35.00 pivot set on 28 April 2020, still roughly 6% below the 35.95 prior high. This marks the entry as anticipatory: the 33.74 close came a session before the pivot cleared, which happened on 6 May 2020 at a 37.22 close.
The real move came the next session. On 6 May 2020, TWST opened at 34.42, pushed to a 40.00 intraday high, and closed at 37.22 on 788,405 shares, roughly twice the recent average. That’s the day the 35.00 pivot actually gave way, and it did it on the volume expansion a base breakout wants. The lesson sits in the gap between those two bars: the entry was taken as the stock tightened under resistance, and the volume confirmation printed one session later. A base 48.4% deep, resolving up through the 35.00 resistance shelf, is the textbook shape. Here it’s carried by a company whose story was accelerating at the same time.
What Twist Bioscience was building in May 2020
Twist Bioscience writes synthetic DNA at industrial scale on a silicon platform, selling genes, oligo pools, and NGS tools to research and biopharma customers. In the spring of 2020 that platform found a timely use. The company launched fully synthetic SARS-CoV-2 RNA controls for use as positive references in developing NGS and RT-PCR tests, and those controls were listed on the FDA site as reference materials. It expanded its NGS line with a methylation product and a respiratory-virus research panel covering SARS-CoV-2 and related pathogens. Twist’s fiscal second-quarter report landed that same week, on 7 May 2020, with management pointing to continued revenue growth.
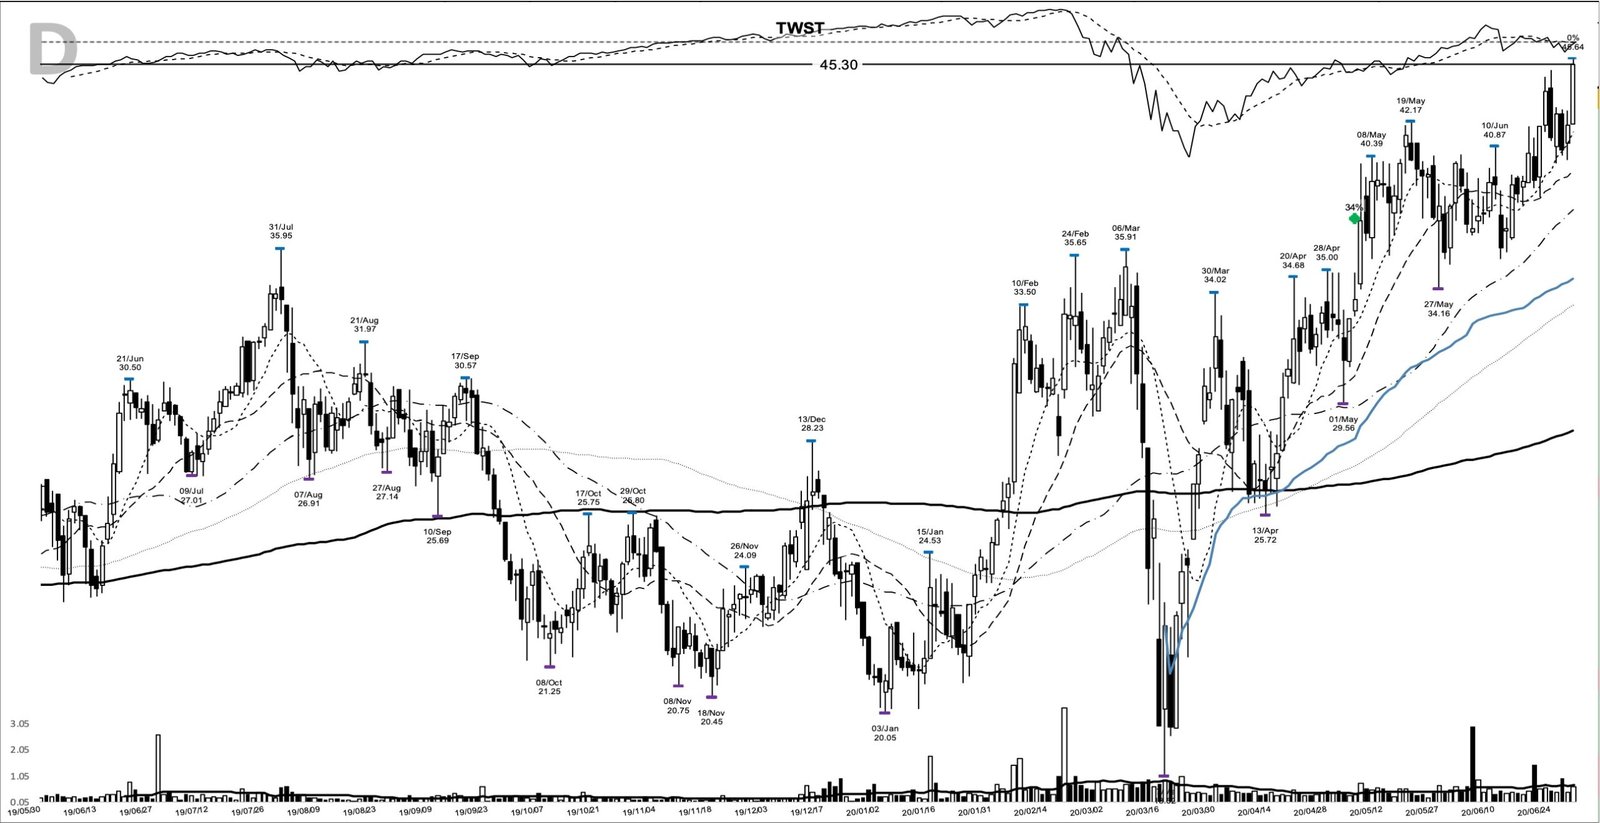
By 30 June 2020 the stock closed at 45.30, already 34.3% above the entry after a tight two-month advance. A growing business with a real catalyst, trending above rising averages, is what makes a base resolve up instead of fail. That’s the fundamental engine behind the pattern.
The tape that rewarded leaders off the March 2020 low
The backdrop here was unusually kind to strength. The broad market had bottomed on 23 March 2020 and turned into one of the most powerful recoveries on record, led by growth, biotech, and anything tied to the pandemic response.
May 2020 sat in the odd stretch where the recovery had been confirmed weeks earlier yet almost nobody believed it, and the breakouts kept working anyway, report after report. In that kind of tape the failure level under a fresh base matters more than any macro opinion, and this base offered one close by.
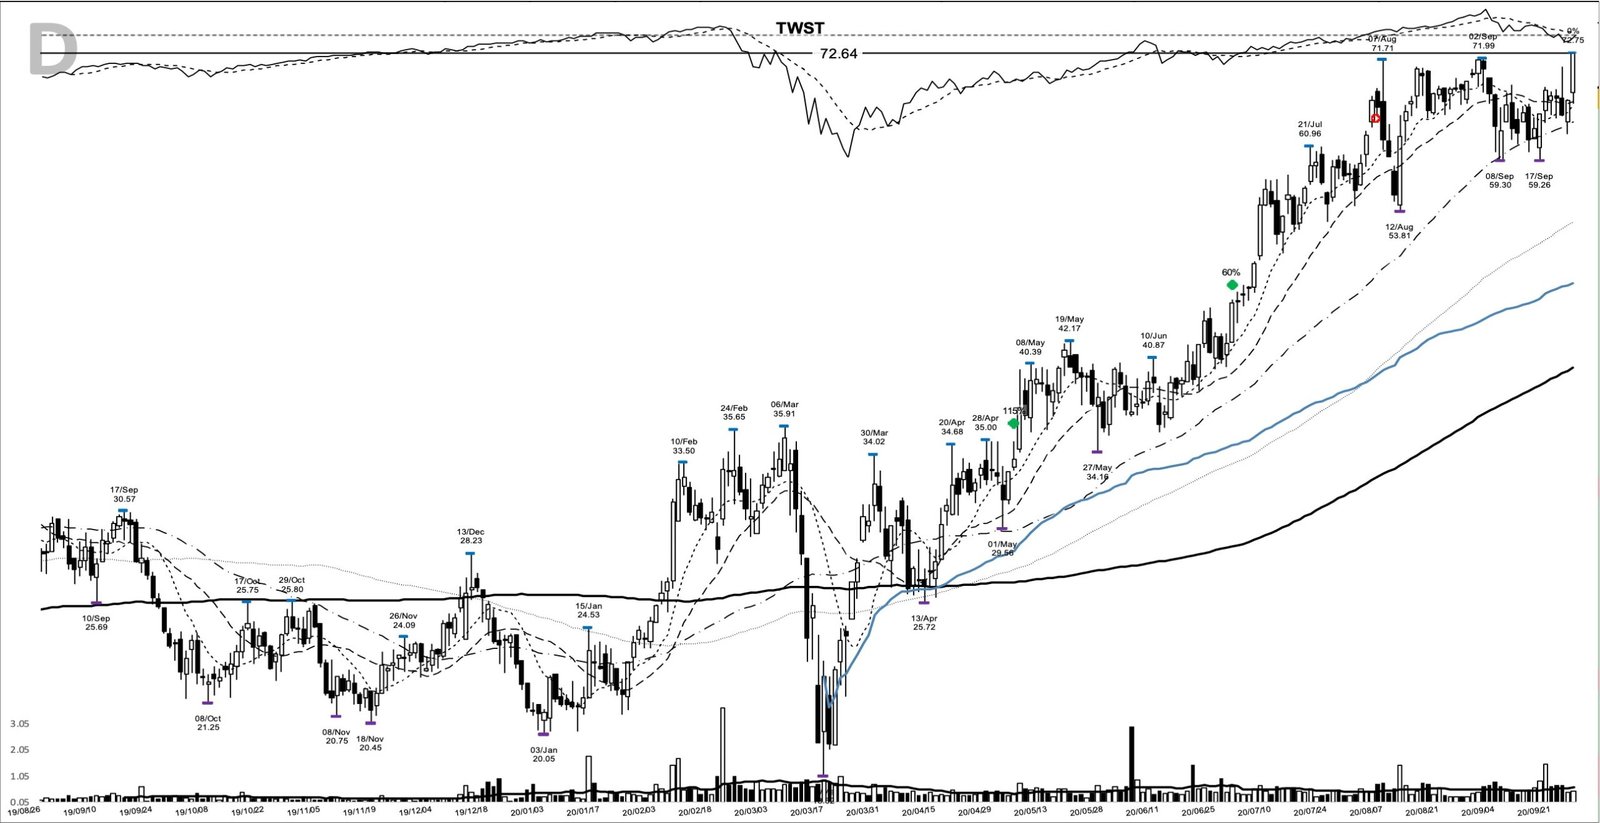
By 25 September 2020 TWST closed at 72.64, up 115.3% from the entry, after basing again in the mid-60s and pushing off it. Each of these shelves gave the trend a fresh place to prove itself.
Spotting the TWST base breakout before 6 May
Here’s the practical part, the read a trader could have made in advance. Into the pivot, the trend posture was already constructive: on the entry day the 10, 20, and 50-day moving averages sat at 32.62, 30.65, and 29.46, stacked in order and rising, with price 3.4% above the 10-day line. The stock had closed above that 10-day line for only two straight sessions, so this was a fresh reclaim, not an extended run. The base low was 18.52, dated 17 March 2020, and the base high was 35.91 from 6 March 2020. The 20-day pivot sat at 35.00, and the last shelf before the breakout bottomed at 29.56 on 1 May 2020.
From those anchors, the plan writes itself. A trader could have set a buy trigger above the 35.00 pivot, with an initial stop below the 29.56 shelf, and a hard invalidation below the 18.52 base low where the whole structure fails. Once the trend was underway, the sensible stop is a trailing one: ride the 10-day moving average while the move is young and fast, then widen to the 20-day line once price is well advanced and it’s earned more room. That’s the difference between a plan and a hope: it fixes the entry, the risk, and the exit before the first share trades. The archive marks the entry at 33.74, a session before the pivot broke; a more conservative version waits for the 6 May push through 35.00 and pays up for confirmation.
From 33.74 to a 214.07 peak: how the trend played out
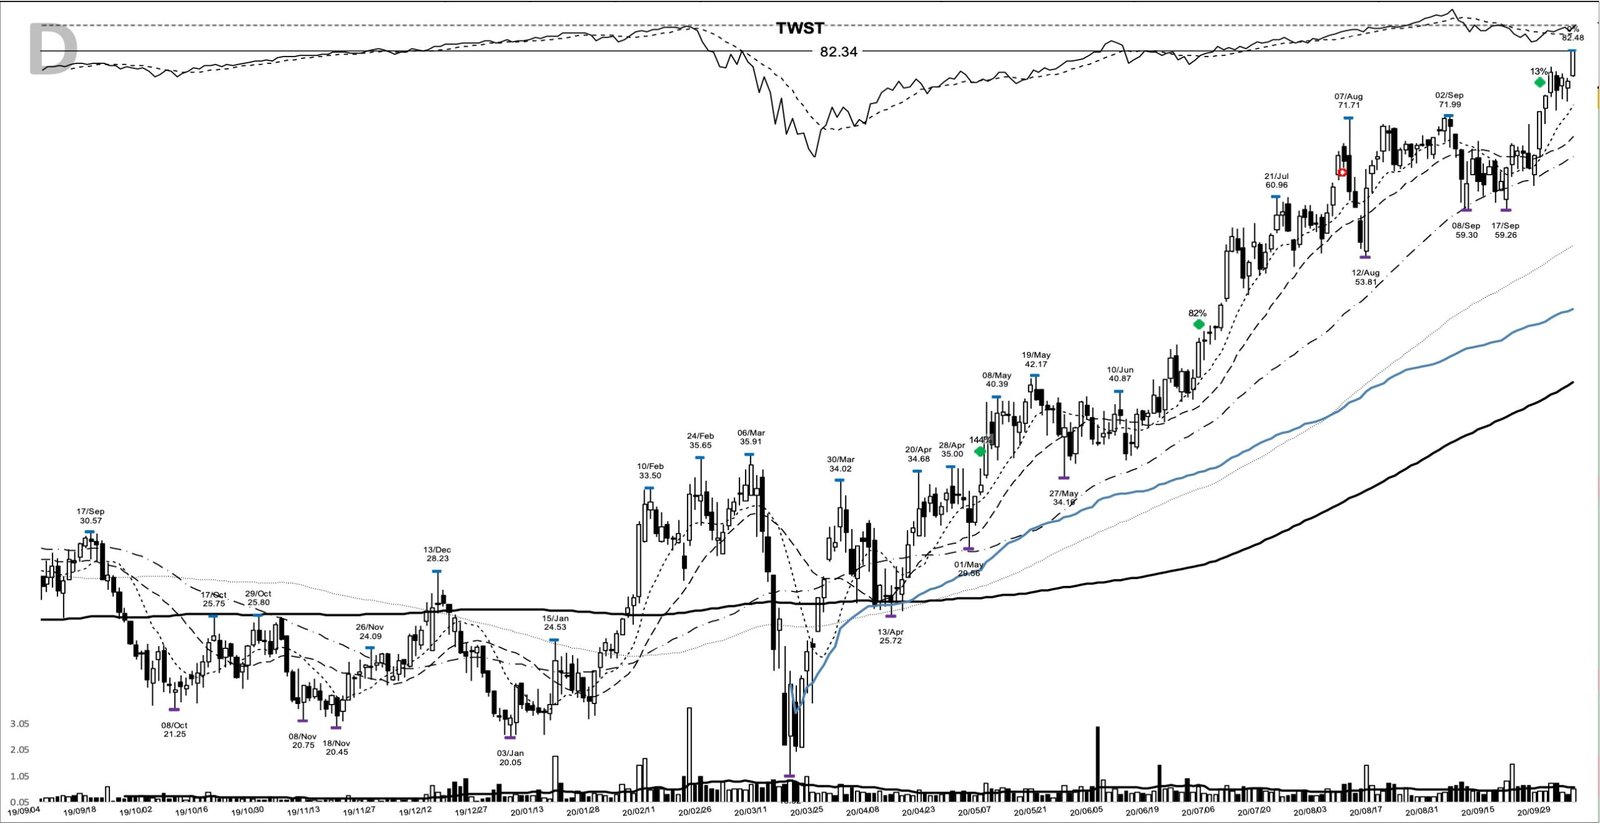
What you’re watching for next is continuation: higher lows into rising averages, and fresh bases that break rather than fail. TWST delivered that for months. By 5 October 2020 it closed at 82.34, up 144.0% from the entry. Each new shelf that resolved higher was another place strength invited adding to the position, always into the trend, never against it.
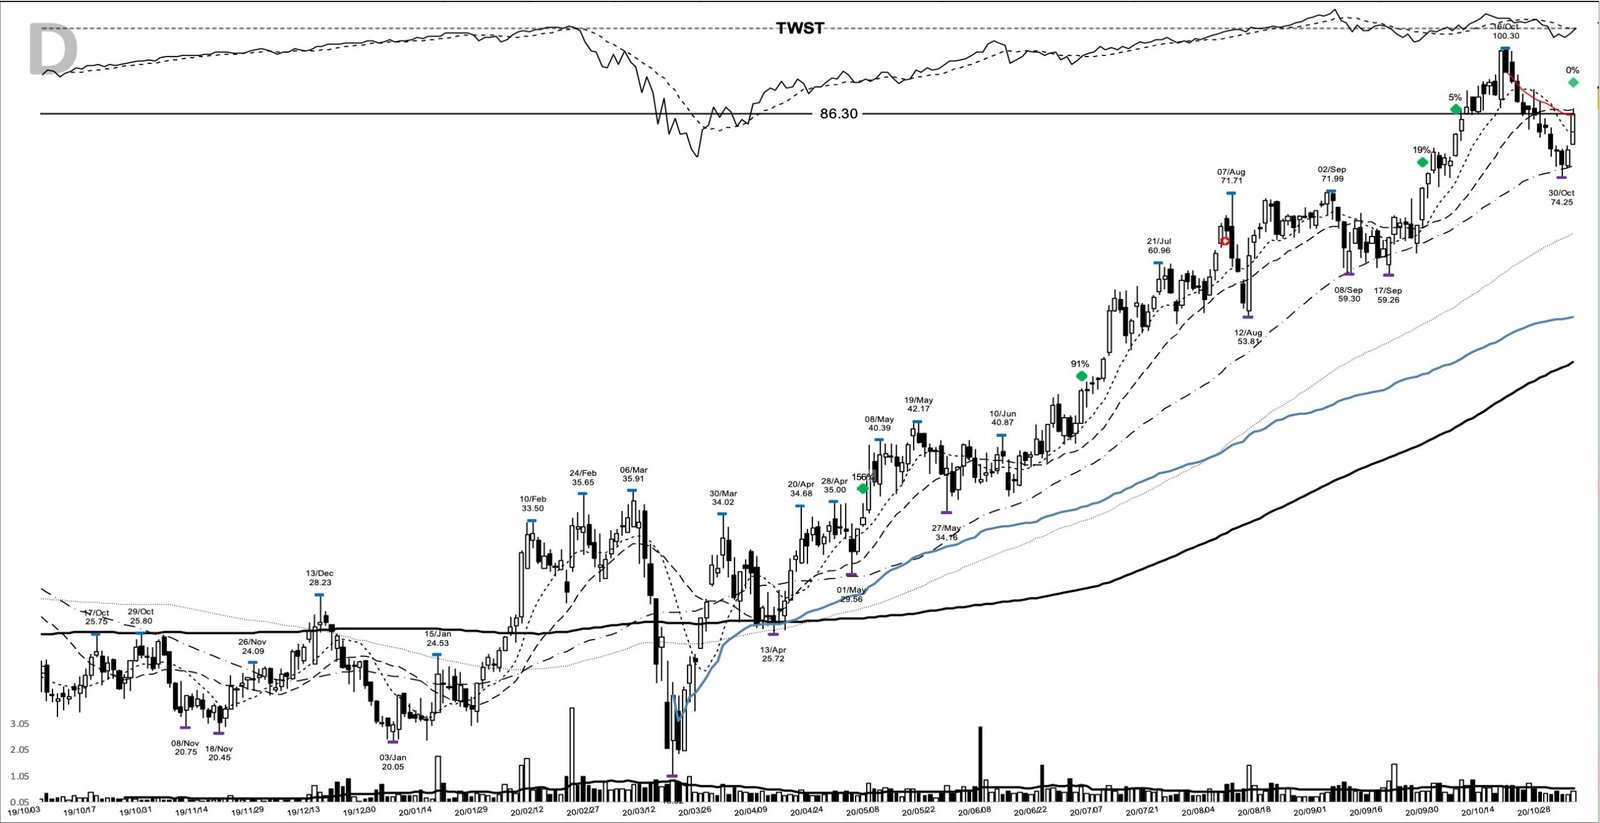
The 3 November 2020 close of 86.30 came as the market itself turned up hard into year-end. Then the advance steepened. The chart offered another add at the 128.58 close on 4 December 2020, up 281.1%, and again at the 144.60 close on 17 December 2020, up 328.6%. Adding into strength on the way up is the discipline Jesse Livermore described a century ago, and it’s what turns a good trade into a large one.
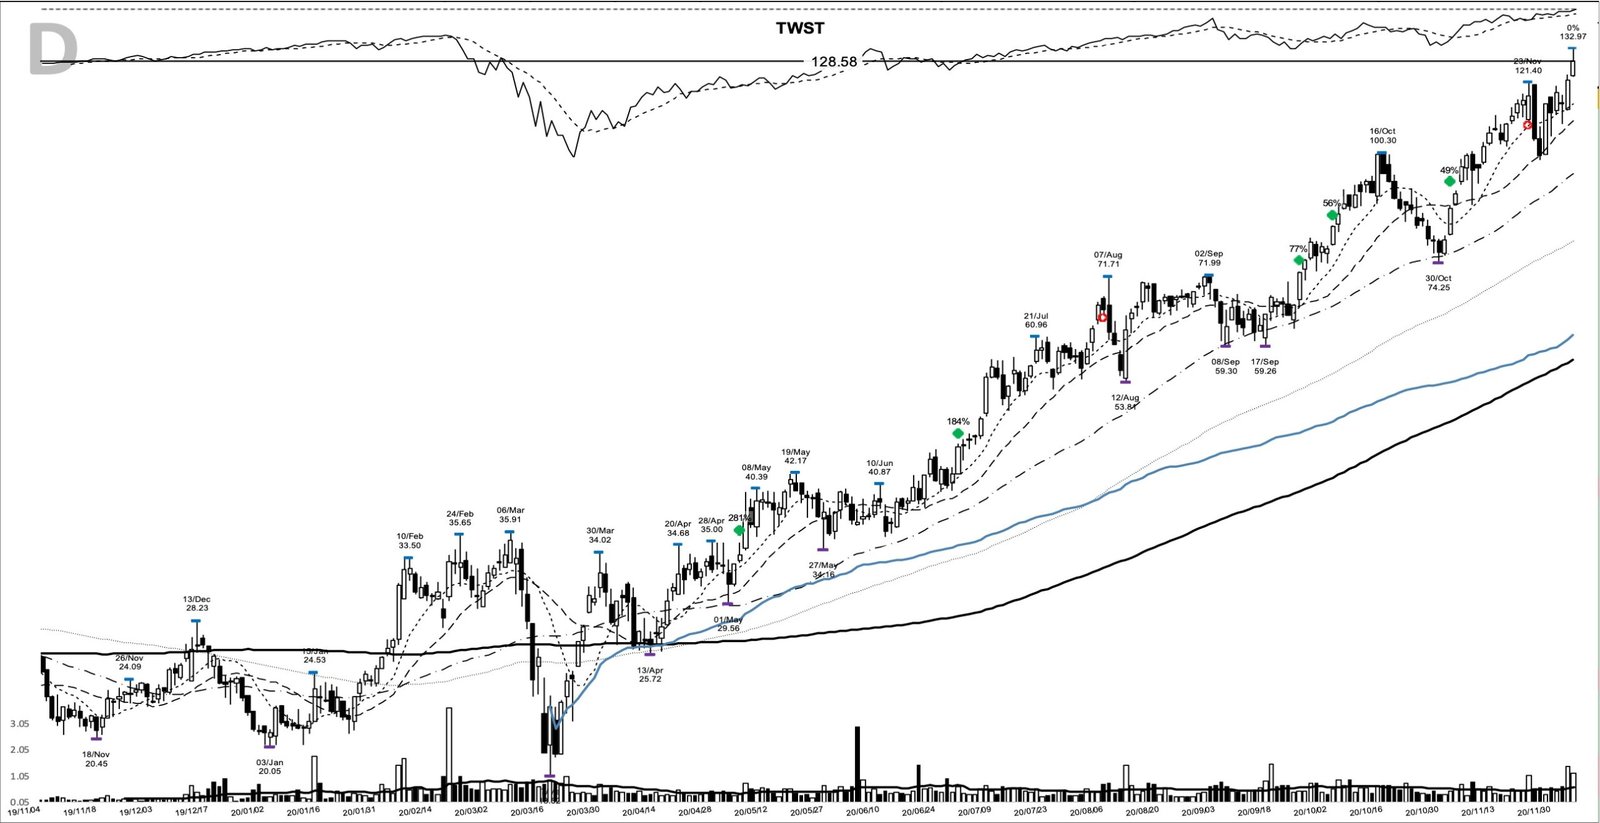
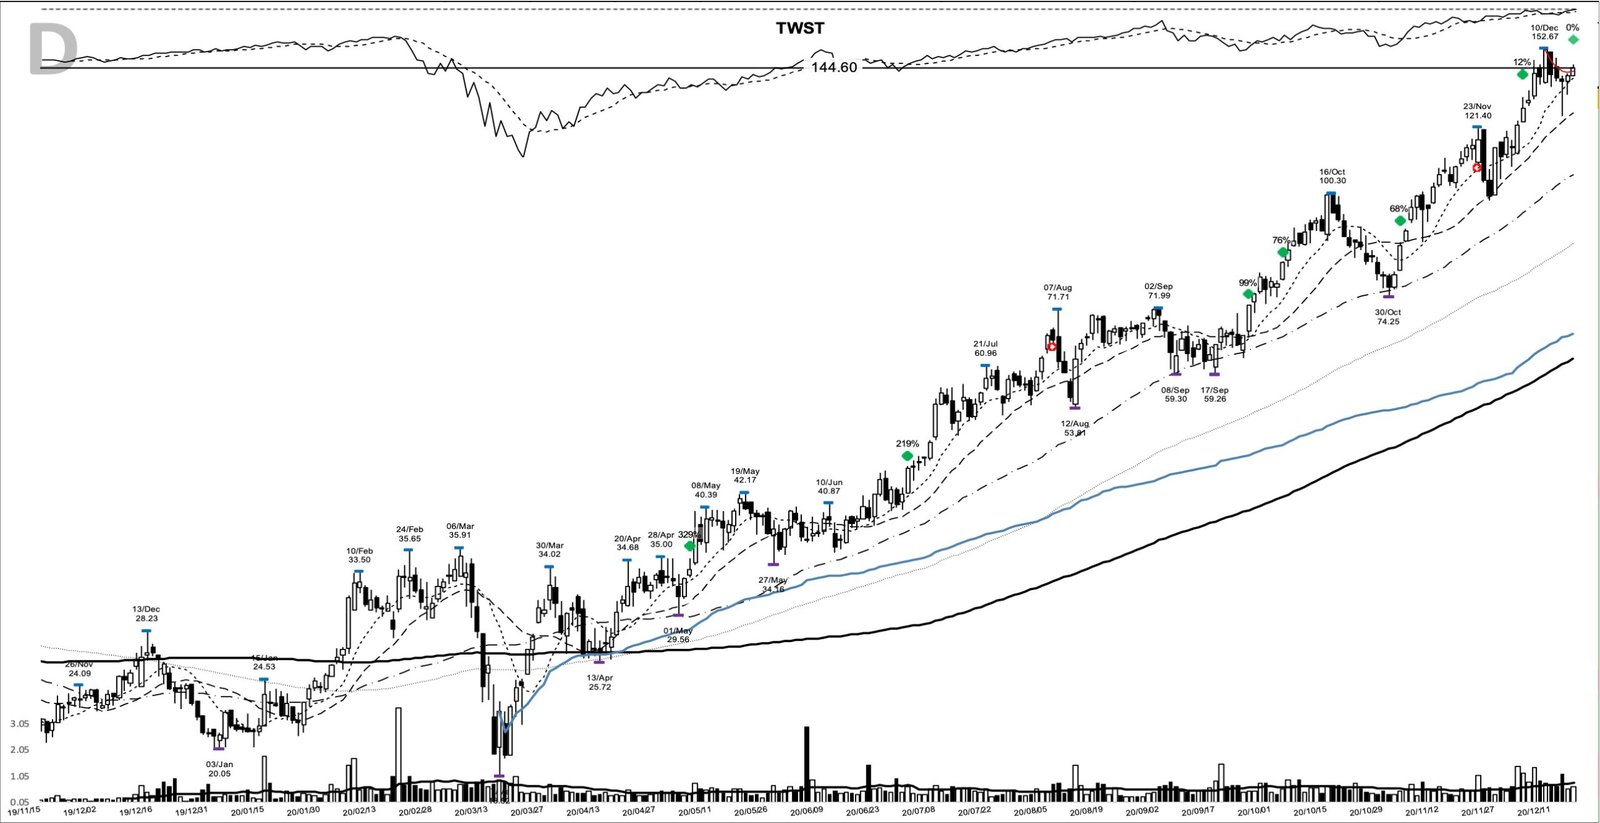
The trend topped in January. Price peaked at 214.07 on 21 January 2021, but note the shape of that bar: it opened at 212.13, spiked to 214.07, and closed weak at 194.53, well off its high. That’s distribution, the kind of reversal day that ends advances. The exit printed at 154.95 on 17 February 2021, closing the move 359.2% above the entry after 288 calendar days.
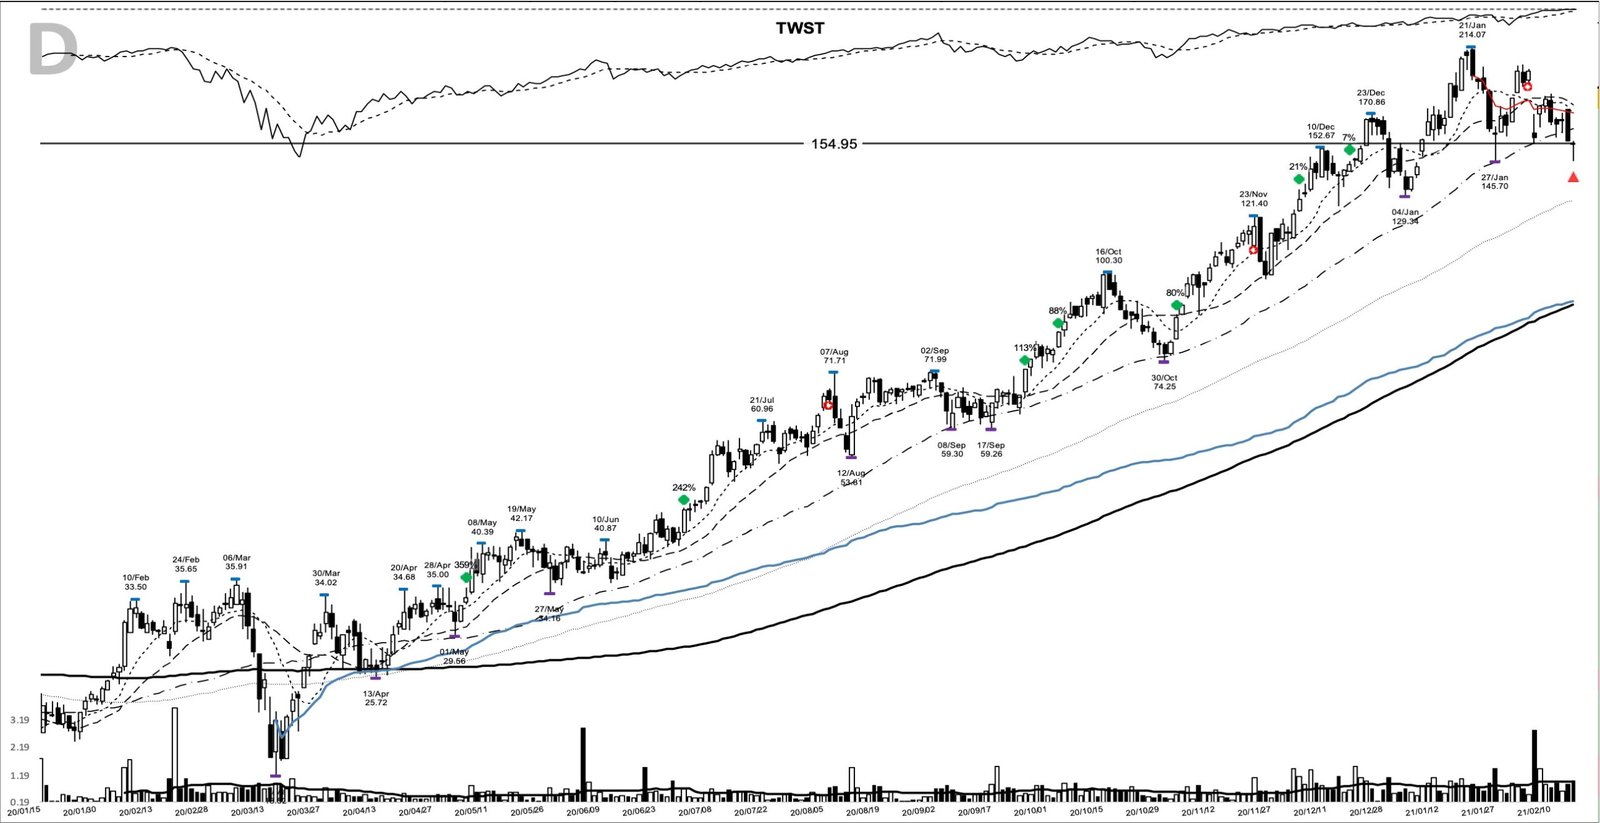
Put a number on it. From the 33.74 close to the 154.95 exit, 1,000 dollars riding the full move would have become about 4,592 dollars.
The exit’s mid-February timing landed inside a market running hot: dip after dip was being bought, options activity was extraordinary, and even the optimists were saying the word bubble out loud. Exiting a multi-bagger into that kind of strength, on the chart’s own signal, is what selling into strength actually looks like in practice.
Where the TWST breakout could have fooled you
This chart is a winner, so it’s easy to read as obvious. It wasn’t. The entry day itself, 5 May 2020, traded on 0.9x volume, below its own average. A trader buying that 33.74 close purely “because it looked ready to break out” was buying before the volume signal actually printed, a full session ahead of the real confirmation. Light volume on the entry bar is a caution, not a green light, and reading volume correctly is what separates the two.
There is a second trap at the other end. The 214.07 peak was an intraday spike that closed near the low of its range. Nothing about this pattern promised anyone the high tick. A trader anchored to that 214.07 print, refusing to exit below it, was giving back real gains by the 154.95 close three weeks later, waiting on a stock that had already reversed. The adds carried their own risk too. Buying the 128.58 add on 4 December, up 281% from the entry, meant accepting the drawdown that comes with an extended, fast-moving name. That’s the tax on chasing a leader higher. The pattern rewards adding into strength, and it’ll charge more downside for every add higher up the trend.
Learn the base. Ride the leader.
The takeaway from TWST is straightforward. A real leader gives you a defined entry, a clear invalidation, and then months of chances to add and hold if you let the trend run. A base breakout never guarantees a triple, and the entry day here printed on light volume. Learn the pattern. Ride the trend. Keep the gains.
Related studies
To go deeper on the pieces of this trade, these guides connect directly: William O’Neil on base breakouts in market leaders, reading volume for breakout confirmation, and position sizing for adding into a trend.
Price and volume figures are computed from split-adjusted daily OHLCV data; company figures come from SEC filings where cited.
Educational content only. Not investment advice. Trading involves risk. You are responsible for your decisions.
Get the free Market Wisdom e-book
Join Trends and Breakouts — historical winners, breakout studies, and risk lessons. No spam, unsubscribe anytime.