
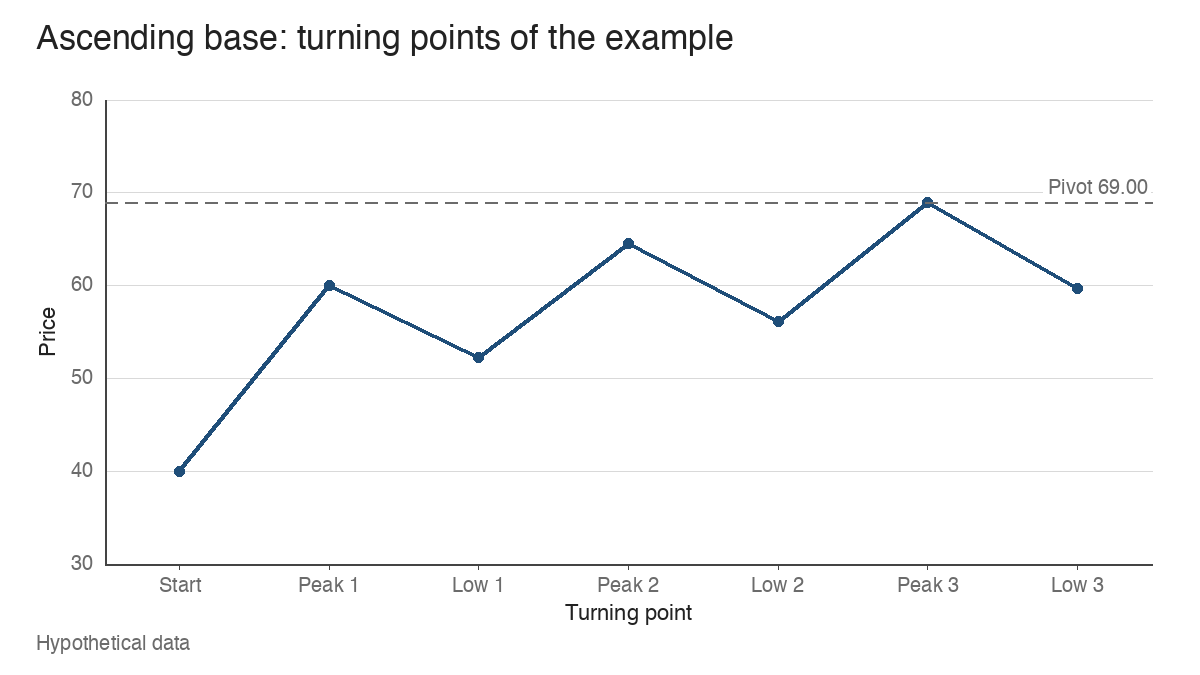
Take a hypothetical growth stock that has climbed from 40.00 to 60.00, a 50% advance, and then starts to slip. Over the next few months it pulls back to 52.20, recovers to a new high at 64.50, slips to 56.10, pushes up to 69.00 and dips once more to 59.70. Each setback is roughly the same size. Each one starts and ends higher than the last. That rising sequence of three pullbacks is what chart readers in the growth-stock tradition call an ascending base, and the hard part is telling, in real time, whether you’re looking at one or simply at a stock that keeps wobbling.
This guide builds the example one stage at a time, so the difference between an emerging possibility and a completed formation stays visible. All prices are hypothetical.
The uptrend has to come first
An ascending base is a continuation structure. It only makes sense inside an advance that already exists, which is why the example begins with the move from 40.00 to 60.00. A stock drifting sideways near its lows can print three higher lows in a row, and that sequence carries a different meaning: it may be the start of a trend, while an ascending base is a pause within one.
The prior advance also tells you which base you’re counting. A trader who keeps a base count through the life of an advance would log this as the first base after the run from 40.00. A rising structure that appears as the third or fourth base in a long move is the same shape on a far more mature trend, and the later count is usually read with more caution.
Revealing the ascending base stage by stage
The useful discipline is to look at the chart as it would have appeared at each point, without the benefit of the finished picture.
| Stage | What the chart shows | What can fairly be said |
|---|---|---|
| After the first low at 52.20 | A 13.00% pullback from the 60.00 peak | An ordinary pullback in an uptrend. Nothing more. |
| After the second peak at 64.50 | A new high, 7.5% above the first peak | The stock has resumed its advance. No base yet. |
| After the second low at 56.10 | A 13.02% pullback that holds 7.47% above the first low | Two reactions at rising prices. An ascending base is now a possibility. |
| After the third peak at 69.00 | A third high, 6.98% above the second | The upper boundary is taking shape, still with only two completed reactions. |
| After the third low at 59.70 holds | A 13.48% pullback, the low 6.42% above the second | Three reactions with rising highs and rising lows. The formation is complete once price recovers from this low. |
The temptation sits in rows three and four. Two higher lows can look persuasive, but plenty of structures stop at two reactions and turn into something else. Calling the base before the third pullback has finished and held is pattern recognition running ahead of the evidence.
Plotted as a path of turning points, the finished example shows both boundaries climbing together.
Reference points and the conventional pivot
Four sets of levels define the structure:
- Reference peaks: 60.00, 64.50 and 69.00, the highs from which each pullback starts.
- Pullback lows: 52.20, 56.10 and 59.70.
- Upper boundary: the line through the three peaks, rising by 7.5% and then 6.98%.
- Pivot: by convention, the high of the third peak, here 69.00.
William O’Neil, whose descriptions of base patterns shaped much of this vocabulary (see the William O’Neil master profile), described the ascending base with a few numerical habits: three pullbacks, each commonly in the 10% to 20% range, with the whole structure spanning roughly 9 to 16 weeks. Treat those figures as conventions that make the shape recognisable. They aren’t market laws, and a base with one 22% pullback or a 17-week span isn’t invalidated by arithmetic alone. The example’s three depths of 13.00%, 13.02% and 13.48% sit comfortably inside the conventional range.
What the rising lows suggest, and what they can’t prove
The supply-and-demand reading goes like this. Each time the stock sells off, buying appears at a higher price than the time before: 52.20, then 56.10, then 59.70. Sellers who wanted out near 60.00 eventually let the stock through to 64.50, and the same happens at 69.00. The structure suggests demand willing to pay progressively more, which reads as resilience.
That’s an interpretation of price behaviour. The chart can’t tell you who is buying. Rising lows are often described as institutional accumulation, but a price chart has no names attached, and the same footprint can come from a broad crowd of smaller holders or from short sellers covering. Treat the accumulation story as a hypothesis the chart is consistent with, and look to volume and relative strength for anything stronger.
Ascending base versus flat base, three weeks tight and VCP
The defining feature of the ascending base is its rising price boundaries. Several neighbouring patterns share some of its traits, which is where most misreads start.
| Pattern | Defining geometry | How it differs from an ascending base |
|---|---|---|
| Ascending base | Three pullbacks; peaks and lows both step higher | Reference case |
| Flat base | A shallow, mostly horizontal range, often 15% deep or less | Boundaries are level, so the highs don’t step up |
| Three weeks tight | Three weekly closes within roughly 1% to 1.5% of each other | A single tight cluster of closes, with no sequence of reactions |
| Volatility contraction pattern | Successive pullbacks get smaller, for example 18.0%, 9.9% and 5.0% | Defined by shrinking depth; the boundaries can be flat or rising |
The comparison with the volatility contraction pattern is the one that trips readers. In the example, the three pullbacks measure 13.00%, 13.02% and 13.48%, so the third is fractionally the deepest. The base still qualifies as ascending because its peaks and lows rise. Progressive contraction is a separate observation: some ascending bases show it, this one doesn’t, and its absence doesn’t break the pattern. Folding the two ideas together leads to looking for tightening that the ascending base never required.
Judging the quality of each pullback
Recognising the shape is the first pass. A trend-following reader then grades it, and the checks look like this:
| Question | Evidence that answers it | What the example shows |
|---|---|---|
| Are the pullbacks of reasonable depth? | Percentage decline from each peak | 13.00%, 13.02% and 13.48%, consistent and within convention |
| Are they orderly? | Few wide-range down days, closes in the upper part of weekly ranges | Not specified in the price-only example; this check needs the bars |
| Does volume dry up on the declines? | Volume on down weeks against up weeks, read the way any base’s volume is read | A constructive base shows lighter volume into each low and heavier volume on recoveries |
| Is the stock outperforming? | The relative strength line against the index | A line holding near its highs through the base is the supportive reading |
| Is the market cooperating? | The direction of the major indexes and their distribution days | A base forming while the indexes break down carries more risk of failure |
The relative strength line deserves extra attention here. A rising price structure while the RS line drifts lower means the stock is going up with the market and no faster, which weakens the resilience argument the lows are supposed to make.
Three hypothetical sequences side by side
The same starting point can produce very different structures. Each sequence below begins with the advance from 40.00 to 60.00 and lists the turning points that follow.
- Orderly ascending base: 52.20, 64.50, 56.10, 69.00, 59.70. Three reactions of 13.00%, 13.02% and 13.48%, with every peak and every low higher than the one before.
- Staircase advance: 58.80, 64.50, 63.40, 69.00, 68.10. Dips of 2.00%, 1.71% and 1.30%. The stock is rising in steps, and none of those dips is deep enough to count as a reaction under the usual convention. The chart has rising highs and lows, yet what it shows is an extended trend with no base.
- Damaged structure: 52.20, 64.50, 56.10, 69.00, 51.40. The third pullback falls 25.51% from 69.00 and bottoms at 51.40, 0.80 below the first low at 52.20. Undercutting the earliest low erases the rising-lows sequence, and whatever the chart becomes next, it’s no longer an ascending base.
Drawn on one chart, the orderly and damaged paths match until the final low, while the staircase never pulls far enough from its highs to form a reaction.
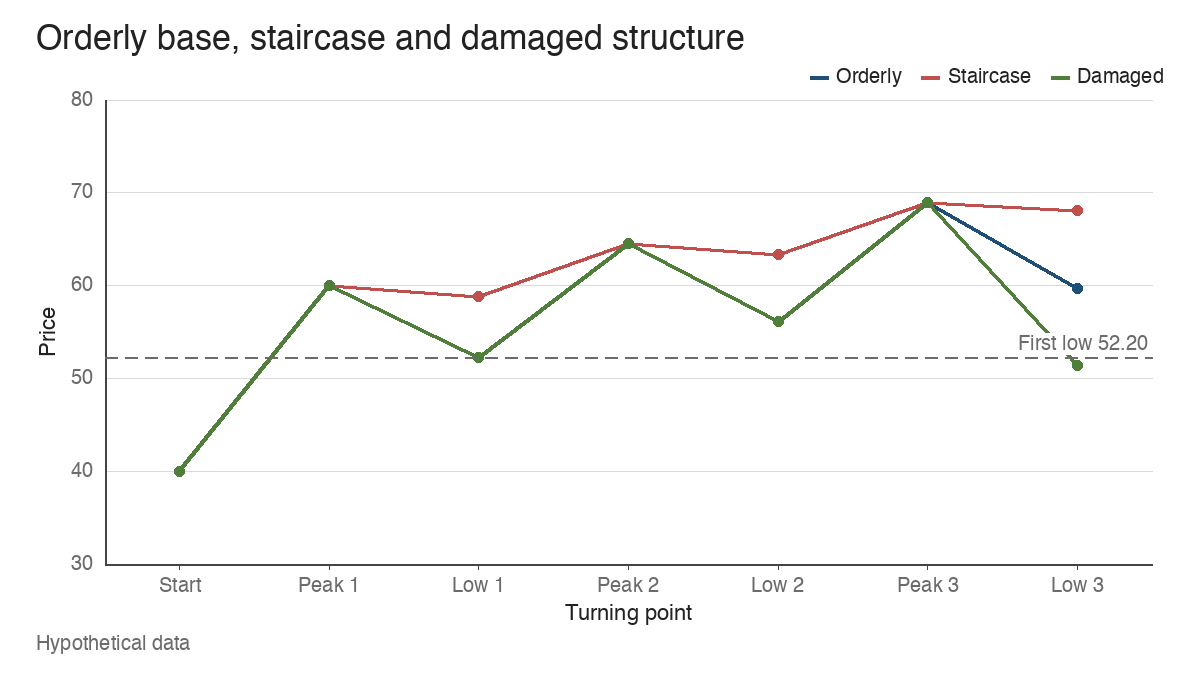
The staircase is the subtler trap. It looks strong, and it is strong, but strength with no reactions gives no base to measure against and no pivot defined by a completed structure.
The upper boundary as an observation point
Once the third low has held and price has recovered, the 69.00 peak becomes the level to watch. A close above it is the conventional breakout event; some chart readers add a small increment, such as 69.10, to filter out a touch that doesn’t carry through.
A breakout through the pivot is an observation, and the pattern doesn’t turn it into an instruction. Readers of growth-stock breakouts usually want volume confirmation on the breakout candle: for example, a session trading 1.9 million shares against a 50-day average of 1.2 million, 58.33% above average. A close through 69.00 on below-average volume is a weaker signal, and it’s the kind of move that more often slips back into the base.
A related convention caps how far price can travel from the pivot before the setup is considered extended: 5% above 69.00 is 72.45. A trader using this pattern might treat price above that level as having left the area where the base offers a nearby reference for risk. Closing back below 69.00 after a breakout is the warning sign covered in the guide to failed breakouts, and an ascending base is no more immune to that than any other shape.
Where the ascending base reading breaks down
Three limits deserve equal weight with the pattern itself.
The boundaries are subjective. Whether a 9% dip counts as a reaction, or whether two nearby lows form one pullback or two, depends on the reader’s choices, and two careful analysts can draw different bases on the same chart.
The structure carries its own extension risk. Because it rises as it forms, an ascending base pivots well above where it started: in the example, 69.00 sits 32.18% above the first low at 52.20. A base that keeps stepping up can leave the stock stretched before any breakout happens.
And recognition guarantees nothing. No success rate for ascending bases is offered here, because figures quoted for named patterns tend to come from hand-picked winners. A clean three-step structure tells you where demand has shown up so far. Whether it shows up again above 69.00 is something only the next sessions can answer, and the volume, the RS line and the market will say more about that than the shape will.
Learn the pattern. Ride the trend. Keep the gains.
Educational content only. Not investment advice. Trading involves risk. You are responsible for your decisions.
Get the free Market Wisdom e-book
Join Trends and Breakouts — historical winners, breakout studies, and risk lessons. No spam, unsubscribe anytime.