Futures Curve: Contango, Backwardation and Roll Yield

A commodity chart can mislead you without a single bad print. Pull up a multi-year continuous chart for crude oil or natural gas, watch it grind higher, and it's tempting…

Comments Off on Futures Curve: Contango, Backwardation and Roll Yield

Adjusted Price Series: Why Your Old Chart Prices Change

Two charts of the same stock, side by side, and they disagree. One shows a long climb toward 100.00 that halves to 50.00 in a single session. The other runs…

Comments Off on Adjusted Price Series: Why Your Old Chart Prices Change

Hidden Markov Model: What Market Regime Labels Mean

You open a backtest and one line stops you. The strategy, it reports, only performs in the low-volatility regime. Somewhere a stretch of the chart has been tagged calm and…

Comments Off on Hidden Markov Model: What Market Regime Labels Mean

Index Weighting Methods: Price, Market Cap, and Equal

The index closed up eight tenths of a percent, and a typical growth watchlist was a wall of red. Most of the names on that watchlist finished lower on the…

Comments Off on Index Weighting Methods: Price, Market Cap, and Equal

Portfolio Turnover Explained: Reading the Number Right

Two fund fact sheets sit open on a screen. One reports portfolio turnover of 28 percent for the year. The other reports 165 percent. The instinct is to read the…

Comments Off on Portfolio Turnover Explained: Reading the Number Right

Look-Ahead Bias in Backtesting: The Timestamp Test

An equity curve slopes up and to the right, smooth, barely a drawdown across ten years. It reads like a finished strategy. Then you check one detail: the ranking that…

Comments Off on Look-Ahead Bias in Backtesting: The Timestamp Test

Structural Break: When Old Market Data Stops Working

Pull ten years of daily data into a backtest, fit a trend filter that looks clean across the whole sample, then run it forward and watch it come apart. Sometimes…

Comments Off on Structural Break: When Old Market Data Stops Working
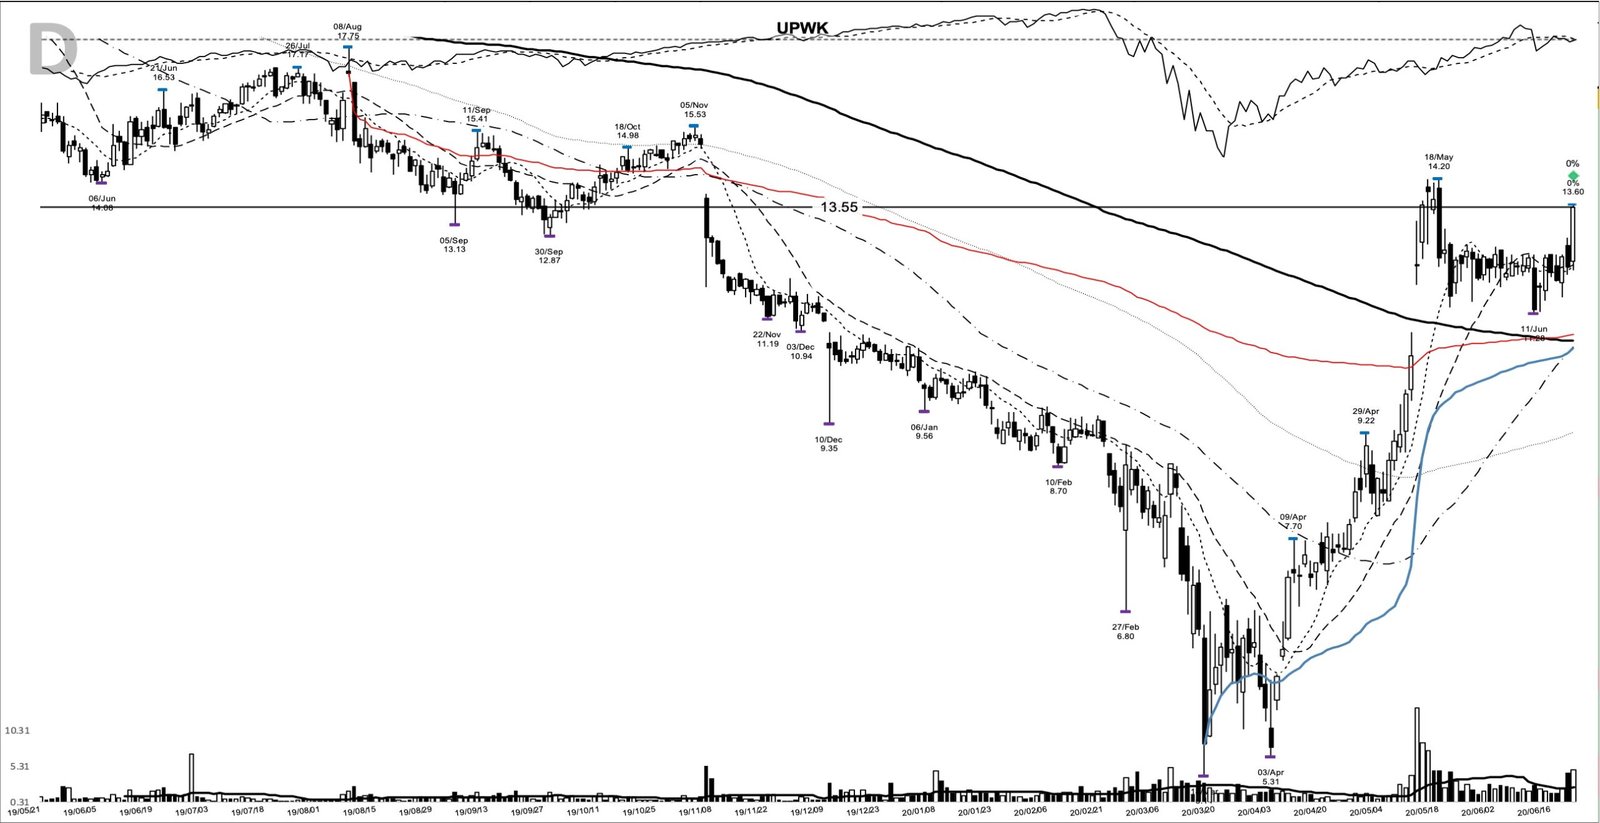
Read more about the article UPWK +222%: a base breakout in the remote-work boom, June 2020
UPWK on the 2020-06-22 breakout entry, from my chart archive

UPWK +222%: a base breakout in the remote-work boom, June 2020

In June 2020, UPWK cleared a well-defined pivot and kept climbing. Upwork broke out of a six-month base at a close of 13.55, then trended to a 43.58 close on…

Comments Off on UPWK +222%: a base breakout in the remote-work boom, June 2020

Index Reconstitution: How Benchmark Rebalancing Works

On the last Friday of June, a full year of index reconstitution lands in a single closing auction. Keep that date circled because the tape turns strange into the close.…

Comments Off on Index Reconstitution: How Benchmark Rebalancing Works

Tail Dependence: Why Diversified Assets Crash Together

Picture a book of six positions spread across different sectors, the kind that looks diversified on paper. On the three worst sessions of a rough stretch, all six close red…

Comments Off on Tail Dependence: Why Diversified Assets Crash Together