
Two charts can show the same seven-week consolidation, the same 16% pullback and the same pivot drawn across the same high. On the first chart, that consolidation sits a few months after the stock left a long sideways range. On the second, it’s the third rest stop in an advance that has already tripled the price. The pattern looks identical. The position of that pattern inside the advance is completely different, and base counting is the habit of writing that position down.
A base count numbers the successive consolidations a growth stock builds as it trends higher. The first proper base after the advance begins is base 1, the next is base 2, and so on. The number answers one narrow question: how far along is this advance? It says nothing on its own about whether the current base is well built.
What a base count measures, and what stage analysis measures
The two numbering systems get confused because both describe the life of a trend. They work at different scales. Stage analysis divides a stock’s whole cycle into four phases: a basing phase (stage 1), an advancing phase (stage 2), a topping phase (stage 3) and a declining phase (stage 4). A base count lives inside stage 2. It numbers the pauses within the advance.
So “base 3” and “stage 3” describe different things. A stock can be forming its third base while still firmly in stage 2, with a rising 30-week moving average and higher lows. Calling that stage 3 would mislabel a stock that’s still advancing. Equally, a stock in late stage 2 can show a topping-style chart on what is technically only its second base. The count tells you the ordinal position. The stage tells you the phase. A complete read states both.
An early-stage base is the first or second base after the advance begins. A later-stage base is usually the third or later. Those labels describe timing, and they say nothing about quality.
Establish the price history before assigning a number
A cup with handle or a flat base on a cropped chart shows its own shape and nothing else. Before you can number it, you’ll need the history to the left: where the advance started, which consolidations came before, and whether any of them broke the trend badly enough to restart the count.
That means zooming out. A weekly chart covering two to three years usually shows where the stage 1 range ended. Without that starting point, the count’s a guess, and a guessed count carries the same false authority as a measured one.
The hypothetical chart used through the rest of this article looks like this. All prices are invented for illustration.
- Stage 1: 14 months of sideways trade between 18.40 and 24.80. The stock clears 24.80 and begins a stage 2 advance.
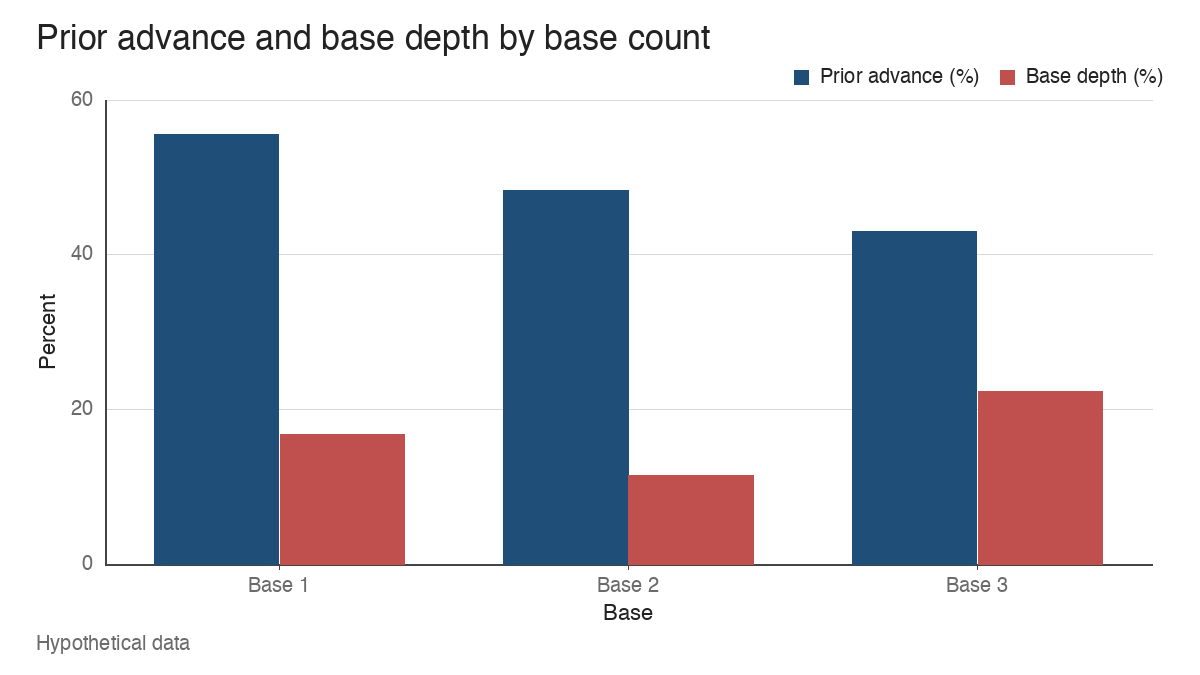
- Base 1: after rising to 38.60, a 55.6% gain from 24.80, the stock builds a seven-week consolidation with a low of 32.10. Depth: 16.8%. Pivot: 38.70.
- Base 2: the breakout runs from 38.70 to 57.40, a 48.3% advance. A six-week flat base follows with a low of 50.80. Depth: 11.5%. Pivot: 57.50.
- Base 3: the next advance runs from 57.50 to 82.30, a 43.1% gain. A nine-week consolidation follows with a low of 63.90. Depth: 22.4%. Pivot: 82.40.
From the 24.80 breakout level to the 82.30 high, the stock has gained 231.9%. Measured from the 18.40 stage 1 low, the gain is 347.3%.
Reading each base with only the evidence available at the time
The discipline here is to read each base as if the right side of the chart were covered. Hindsight makes every count look obvious.
Base 1. The prior run is 55.6% from the stage 1 breakout. The boundaries are 38.60 on top and 32.10 at the low, and that low sits 29.4% above the old 24.80 ceiling, so the stock hasn’t given back its breakout. The prospective pivot is 38.70. Before the outcome, a trader could see that the 16.8% depth was moderate for a first base, that weekly volume dried up in the final weeks of the pattern, and whether the relative strength line was near a new high. In this example it was. When the breakout came, volume ran at 1.8 million shares against a 10-week average of 750,000, a ratio of 2.4. That volume ratio was only visible on the breakout week itself, not before.
Base 2. The prior run is 48.3%. The boundaries are 57.40 and 50.80, a tight 11.5% range, the kind of shallow consolidation the cup-with-handle and flat-base literature treats as constructive. The pivot is 57.50. What’s knowable in advance: the depth is shallower than base 1, the stock held well above the 38.70 pivot of the base before, and the trend of higher lows is intact.
Base 3. The prior run is 43.1%, the boundaries are 82.30 and 63.90, and the pivot is 82.40. Three facts stand out before any breakout. The depth of 22.4% is the deepest of the three bases. The relative strength line sits 6.0% below its own prior peak while price is back near its high. And when price first pushes toward 82.40, volume runs 1.1 million shares against an 850,000 average, a ratio of 1.29, well short of the 2.4 seen at base 1.
The chart below lines up the three bases side by side.
Why counting every minor pause gives misleading precision
During the run from 38.70 to 57.40, the hypothetical stock paused for two weeks, slipping from 47.20 to 44.90. That’s a 4.9% dip. Count it as a base and base 3 becomes base 4, which changes the label without any change in the stock.
Most base definitions use a minimum duration so that a pause like this doesn’t qualify. A flat base is commonly described as lasting at least about five weeks, and a cup with handle at least about seven. A two-week pause doesn’t meet either. Treating it as a base adds a decimal place of precision to a measurement that was never that precise to begin with.
The trap runs the other way too. Very long, messy consolidations sometimes contain what look like two bases stacked together. Splitting them inflates the count. Merging two genuinely separate bases deflates it. Neither choice is wrong if it’s applied consistently, which is exactly why the convention has to be stated.
Why later bases draw more scrutiny
The concern about a third or fourth base comes from three separate observations, and none of them depends on the number itself.
The first is distance travelled. At base 3 in the example, the stock is up 231.9% from its breakout level. Many of the investors who wanted to own it at lower prices already do, and there are more holders sitting on large gains who might sell into strength.
The second is expectation. A stock that has tripled often carries a valuation and a story that already assume continued growth. Good news may not have much room left to surprise.
The third is visible deterioration, and it’s the part a chart can measure. In the example, depth went from 16.8% to 11.5% and then out to 22.4%. The volume ratio on the approach to the pivot dropped from 2.4 at base 1 to 1.29 at base 3. The relative strength line failed to confirm price. Those are measurable changes in the structure.
These are contextual concerns. They don’t prove that buyers are exhausted, and a later base can still break out and run. A common misread treats “base 4” as a sell signal or as a statistical failure rate. The count alone doesn’t support either reading. What the count does is tell you it’s time to look harder at the structure, because the margin for a mistake has narrowed.
Count versus structure: two bases compared
Suppose the chart had looked different. In version B, base 1 is wide and loose: the stock pulls back from 38.60 to 25.40, a 34.2% decline that gives back nearly all of its advance from the 24.80 breakout. Weekly closes swing violently, from 31.20 up to 36.90 (18.3%) and back down to 30.40 (17.6%) in consecutive weeks. A wide and loose base like that shows supply and demand fighting with no resolution.
Now picture base 3 in version B as an orderly consolidation. It drops from 82.30 only to 71.60, a 13.0% depth, and its last three weekly closes are 79.80, 80.40 and 80.10, a spread of 0.75% from lowest to highest. Volume contracts on the down weeks. That’s the kind of tightening the volatility contraction pattern describes.
| Feature | Version B base 1 (early) | Version B base 3 (later) |
|---|---|---|
| Depth | 34.2% | 13.0% |
| Weekly close behaviour | Swings of 18.3% and 17.6% | Last three closes within 0.75% |
| Low relative to prior breakout | 25.40, barely above 24.80 | 71.60, well above the 57.50 pivot |
| Count label | Early | Later |
On count alone, the early base wins. On structure, the later base is clearly the sounder pattern. I’d treat the version B base 1 as the weaker setup despite its lower number, because the chart shows the advance nearly failing. The count supplies context for the structure assessment and can’t stand in for it.
Resets, and why you should state your convention
Counts restart, and that’s where analysts disagree most.
Return to the original chart. Suppose the stock breaks out of base 3, fails, and falls from 82.30 to 48.60, a 40.9% decline. That low undercuts the 50.80 low of base 2. The stock then spends 30 weeks building a new base.
Under one common convention, a decline that undercuts the low of an earlier base resets the count, and the new structure becomes base 1. Under another, the count resets only if the stock falls back toward its stage 1 range, which hasn’t happened here, since 48.60 is still far above 24.80. That analyst would call it base 4. A third approach resets the count when the general market goes through a substantial correction and the stock bases alongside it, on the reasoning that a broad decline shakes out holders across the board.
They’re all defensible, and they produce different numbers on the same chart. The practical fix is to write the convention next to the count: “base 1 (reset on undercut of base 2 low)” carries far more information than “base 1”. A prolonged rebuild also deserves a note, since 30 weeks of sideways trade can look more like a fresh stage 1 than a pause in stage 2.
The base counting idea is most closely associated with the growth-stock work of William O’Neil, who described later-stage bases as more prone to failure. That observation came from studying historical leaders. It describes a tendency, and the exact numbers depend on how bases are defined and counted.
Base counting describes how mature an advance is, and stops there
A base count is partly interpretive. Two careful analysts can look at the same chart and disagree by one, sometimes two, because they define a base differently or reset under different rules. The count doesn’t establish a universal failure probability, and it can’t by itself decide an entry or an exit. What it does well is force the question of where you are in the advance. In the example, the answer at base 3 was “231.9% into the move, with depth widening and volume and relative strength fading”. The count framed that question. The structure answered it.
Learn the pattern. Ride the trend. Keep the gains.
Educational content only. Not investment advice. Trading involves risk. You are responsible for your decisions.
Get the free Market Wisdom e-book
Join Trends and Breakouts — historical winners, breakout studies, and risk lessons. No spam, unsubscribe anytime.