
Picture a stock that ran from 41.20 to 84.60 in five months and then spent eight weeks moving sideways. On a zoomed-out weekly chart the pause looks respectable. Price held above 70.10, the right side climbed back toward the old high, and the total depth was a modest 17.1%. Zoom in and you find a wide and loose base. The weekly ranges averaged 7.70 points, closes jumped from the top of the bar to the bottom and back again, and the 78.50 area was crossed in seven of the eight weeks. That instability is the reason a structure that passes a quick glance can still be very hard to read.
This lesson is about base quality. The shape names you already know stay useful. What I want to show is how to read the price action inside them, using one hypothetical stock drawn two ways: once as an unstable base, once as an orderly one.
What a wide and loose base describes
Wide and loose describes the character of a consolidation. Price keeps making large swings, reverses abruptly, and rarely settles into a narrow band for more than a week or two. The label sits on top of a shape rather than replacing it, so a recognisable cup, a consolidation that looks flat from a distance, or a neatly rising right side can all carry this kind of instability underneath.
The phrase is common in the weekly-chart tradition associated with William O’Neil, where the quality of a base mattered as much as its outline. A cup with handle is a named structure with its own definition. Wide and loose is an adjective you can apply to that cup, or to almost any other base.
A common misread is to treat it as a universal numerical test. You’ll see rules of thumb about weekly ranges or swing percentages, and they can be handy for organising your own notes. None of them is an agreed standard that turns a chart into a pass or a fail. A 7.70-point average range means something very different on a stock that normally moves 3 points a week than on one that normally moves 7.
Marking the weekly chart: swings, ranges and closes
Here is the unstable version, which I’ll call Base A. Each line is one week, with high, low and close:
- Week 1: high 84.60, low 76.20, close 77.10
- Week 2: high 79.80, low 71.40, close 78.90
- Week 3: high 82.30, low 74.00, close 74.60
- Week 4: high 77.50, low 70.10, close 76.80
- Week 5: high 83.90, low 75.20, close 82.70
- Week 6: high 84.10, low 76.40, close 76.90
- Week 7: high 80.20, low 72.80, close 79.60
- Week 8: high 83.40, low 78.10, close 80.70
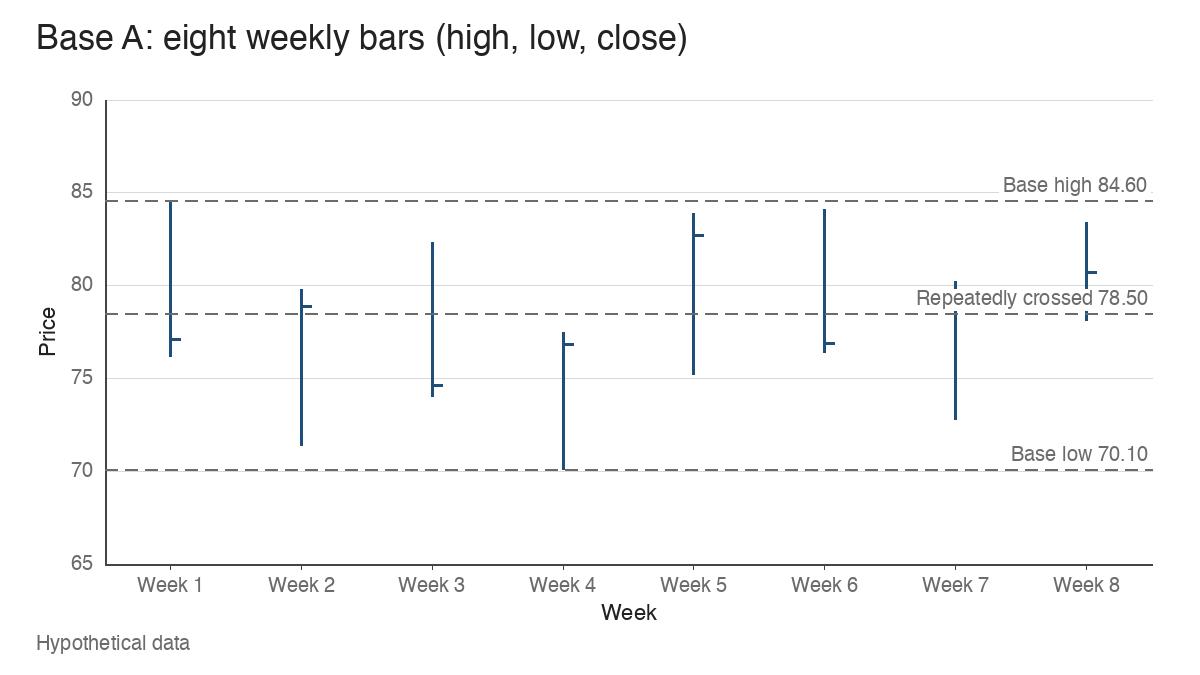
When you annotate a base like this, mark three things before anything else. First the swing highs and lows, which here alternate almost every week: 84.60 down to 71.40, up to 82.30, down to 70.10, up to 84.10, down to 72.80. Second, the size of each weekly range. Seven of the eight weeks span more than 7 points.
Third, and most telling, the closing location: where the close sits within the week’s range, from 0% at the low to 100% at the high. Week 2 closed at 89% of its range. Week 3 closed at 7%. Week 5 closed at 86%, and then week 6 closed at 6.5%, just 0.50 above its low after trading as high as 84.10. That flip from strong close to weak close and back is the signature of instability. A single weak week tells you little. Four flips in six weeks tell you the market hasn’t agreed on a price.
Then draw one horizontal line through the area price keeps returning to. In Base A, 78.50 sits inside the range of every week except week 4. Price keeps crossing the same level without holding either side of it for long.
Depth and looseness measure different things
Base A is shallow. From 84.60 to 70.10 is a 17.1% decline, which many traders would consider comfortable for a growth stock after a strong advance. It is still erratic.
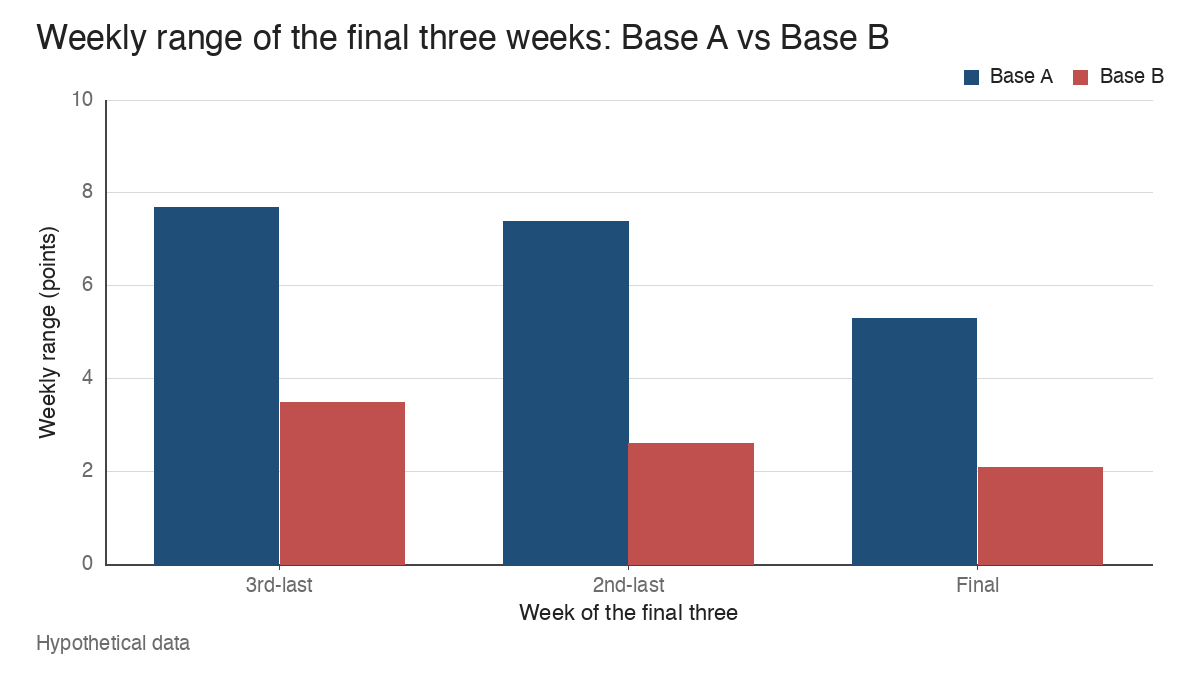
Now the second version, Base B. The same stock falls from 84.60 to 61.30, a 27.5% correction. The left side is violent, with weekly ranges above 9 points. The right side then rallies to 79.80, pulls back to 72.10, rallies to 83.10, pulls back to 74.60, and finally rallies to 83.70 before a last dip to 79.10. Over the final three weeks the highs are 82.60, 82.20 and 81.90, the lows are 79.10, 79.60 and 79.80, and the closes are 80.40, 80.90 and 81.20.
Base B is the deeper base by more than 10 percentage points, and it ends far more orderly. The textbook reading that “shallow equals healthy” is too broad. Depth measures how far price fell. Looseness measures how price behaved while it was down there, and above all how it behaved on the right side, where any later breakout attempt starts.
Why repeated reversals blur the pivot and the invalidation
Ask a simple question of Base A: where is the pivot? The candidates are 84.60, 82.30, 83.90, 84.10 and 83.40. Each is a reasonable choice, and each would produce a different trigger level. The invalidation side is just as murky, with recent lows at 70.10, 72.80, 75.20, 76.40 and 78.10.
Suppose a trader using this structure anchored the pivot at 84.60 and the invalidation just under the week 8 low of 78.10. That’s 6.50 points of room, or 7.7%. The average weekly range inside the base was 7.70 points, so one ordinary week could travel the entire distance from pivot to stop. A level that sits inside the stock’s normal weekly noise carries little information about whether the setup has failed.
In Base B the same exercise is cleaner. The right-side high is 83.70, the last pullback low is 79.10, and the distance is 4.60 points, or 5.5%. The final three weekly ranges were 3.50, 2.60 and 2.10 points. Here a move through 79.10 would be unusual relative to recent behaviour, which gives the level meaning. Loose structures also tend to produce the kind of whipsaw described in the lesson on the failed breakout, because price has already shown it can cross a level and reverse within the same week.
What unsettled supply and demand can and can’t tell you
A common way to explain a wide and loose base is unsettled supply and demand. Holders who bought near the high may be selling into every rally, while new buyers step in on every sharp drop, and neither side has absorbed the other yet. That story fits the chart, and it’s a useful working hypothesis.
It stays a hypothesis. Price and volume record that transactions happened at certain prices in certain quantities. They can’t identify who traded, whether the selling came from funds or individuals, or what anyone intended. Treat any narrative about “institutions distributing” or “smart money accumulating” inside a loose base as a guess layered on the data. The observable fact is narrower and more useful: the market hasn’t settled on a price, and the chart shows it through wide ranges and alternating closes.
The comparison base: smaller swings and tighter closes
Base B’s right side shows what settling looks like. The three pullbacks measured 9.6% (79.80 to 72.10), 10.2% (83.10 to 74.60) and 5.5% (83.70 to 79.10). The second was slightly larger than the first. That matters, because some traders reject a base unless every contraction is smaller than the one before. Real charts rarely behave that neatly. The more useful observation is the overall progression from wide to narrow, finishing with three weekly closes packed into 0.80 points.
This is the same idea that runs through the volatility contraction pattern, though you don’t need to label a base as one to see the tightening. Tight closes on the weekly chart are the visible sign that buyers and sellers have converged on a narrow price area. The base can still be imperfect elsewhere. What changed is that the most recent behaviour is calm enough to define a level.
Reading volume alongside the swings
Volume adds context to each swing, provided you read it with price. In Base A, week 6 traded 1.8 times its 10-week average volume and closed at 6.5% of its range. On the daily chart, the Thursday of that week fell from 82.90 to 77.40 on 1.9 times the 50-day average. That’s an active downside reversal: heavy turnover with price giving up nearly the whole week’s gain.
Week 8 looks different. Its range was 5.30 points, volume ran at 0.7 times the 10-week average, and the close sat at 49% of the range. That’s a quiet pause. On its own it says little, yet a run of weeks like it would be the first sign Base A was starting to settle.
Then there is week 5, which is mixed evidence. Price rose to 83.90 on 1.4 times average volume and closed at 86% of its range, which reads as strong demand. The week also contained an earnings gap, so the volume reflects a one-off event as much as any lasting change. I’d log it as supportive but inconclusive. The guide on reading volume covers this habit in more depth: pair each volume spike with the close and the range before giving it a meaning.
Scale, normal volatility and outside events change the picture
Several things can make a base look looser or tighter than it is.
Chart scale is the first. On an arithmetic chart covering 20 to 90, Base A’s 7.70-point weekly ranges look small next to the advance. On a logarithmic scale fitted to the base alone, the same bars look enormous. Check every base on both before writing anything about it.
The stock’s normal volatility is the second. If weekly ranges averaged 7.20 points during the prior advance, then Base A’s 7.70 is barely above normal, and the looseness is mostly the stock’s personality. If they averaged 3.10, the base is more than twice as volatile as the trend that preceded it, which is a much stronger sign of disorder.
Market conditions are the third. Suppose the broad index fell 9% during weeks 2 to 4. Some of Base A’s swings then belong to the market, and the useful question becomes whether the stock settled faster or slower than the index once the pressure eased.
Corporate events are the fourth. The week 5 earnings gap inflated that bar’s range and volume. One event week can make an otherwise ordinary base look wild. Mark those weeks on the chart so they don’t skew the read.
An untidy base can resolve upward, and a tidy one can fail
None of this predicts the outcome. A wide and loose base can break out and run, especially when the market turns strong underneath it. An orderly base like Base B can fail on the first test of 83.70. If you go back through any historical chart study you’ll find examples of both, and of flat bases that looked perfect and still broke down.
What the description does is organise the evidence. It tells you how clear the pivot is, how meaningful the nearby invalidation level is, and whether the most recent weeks show settling or ongoing conflict. That’s a statement about how readable the chart is, and readability is what lets a trader define risk before a move happens rather than after it. It supplies no forecast and no instruction on its own.
Learn the pattern. Ride the trend. Keep the gains.
Educational content only. Not investment advice. Trading involves risk. You are responsible for your decisions.
Get the free Market Wisdom e-book
Join Trends and Breakouts — historical winners, breakout studies, and risk lessons. No spam, unsubscribe anytime.